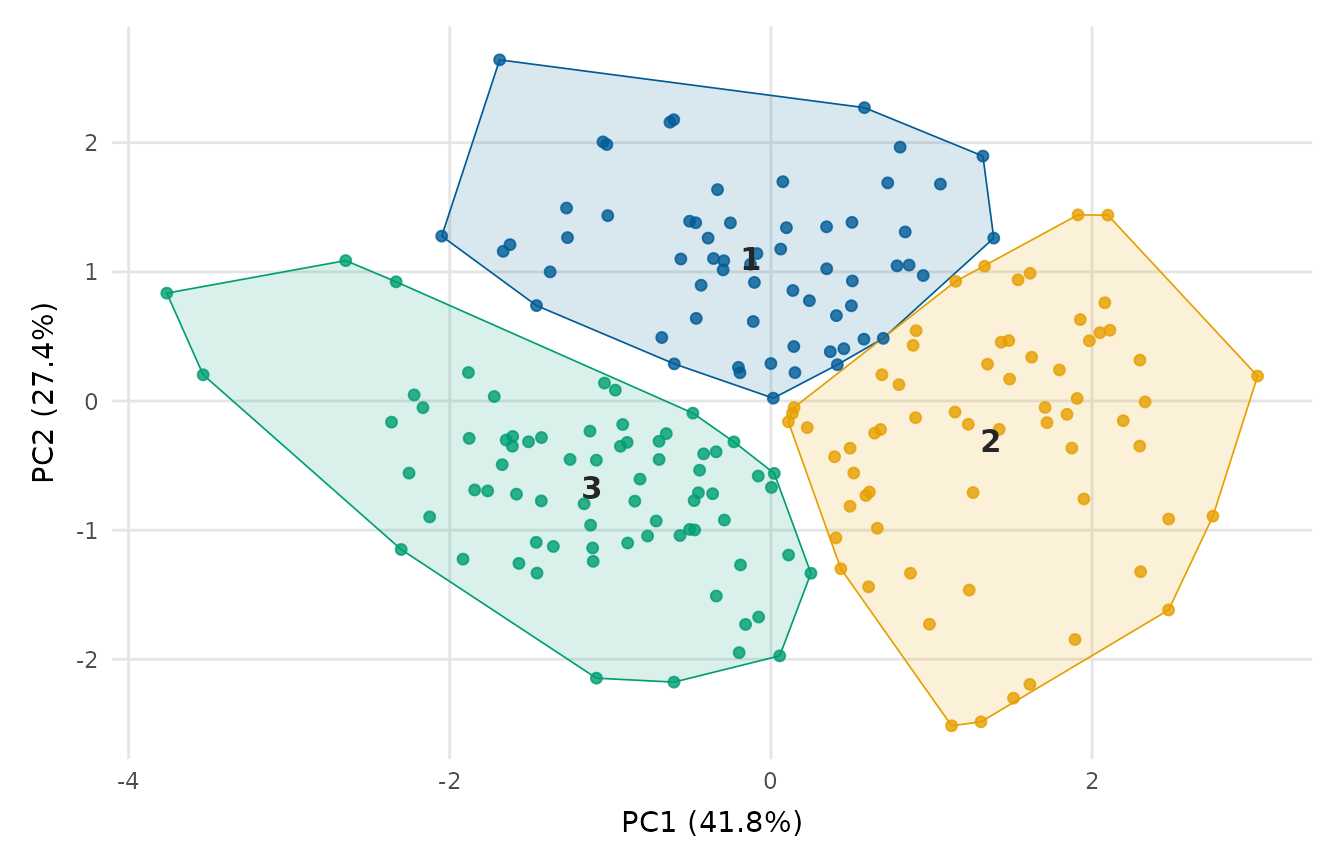
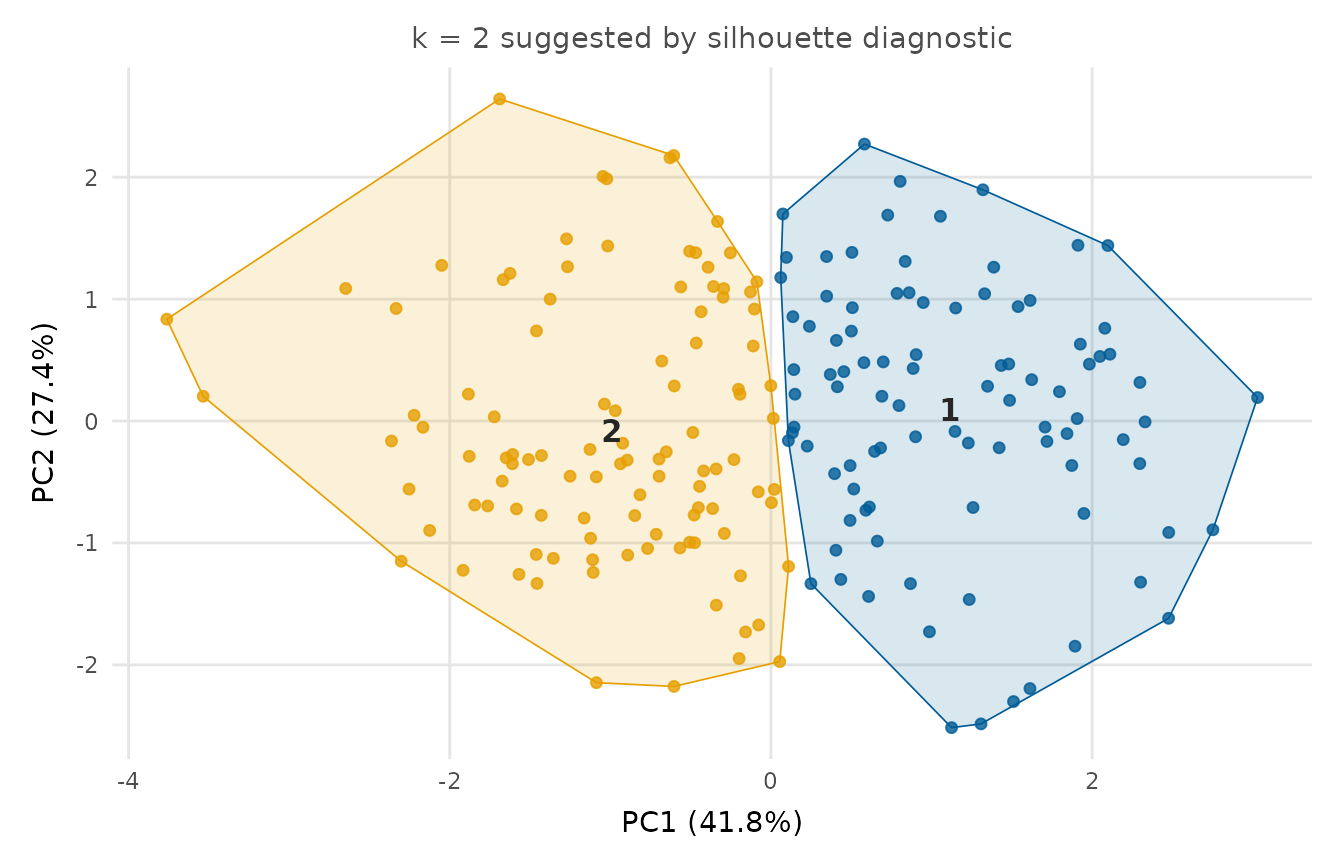
Runs k-means clustering on the numeric columns of a data frame (or uses a supplied cluster assignment) and plots the observations on the first two principal components, coloured by cluster, with optional convex hulls and labelled centroids. Projecting onto principal components means the plot works for any number of variables.
Usage
cluster_plot(
  data,
  cols = NULL,
  k = 3,
  clusters = NULL,
  scale = TRUE,
  suggest_k = NULL,
  k_range = NULL,
  hulls = TRUE,
  label_centers = TRUE,
  point_alpha = 0.8,
  palette = NULL,
  title = NULL,
  seed = NULL,
  nstart = 10,
  iter.max = 10
)
Arguments
- data
A data frame.
- cols
Numeric columns to cluster on (default: all numeric).
- k
Number of clusters for k-means (ignored if
clustersis supplied, or overridden whensuggest_kchooses a value).- clusters
Optional vector of cluster assignments (e.g. from
stats::kmeans()orstats::cutree()); use this to plot a clustering you computed yourself. Hierarchical or PAM assignments (such asstats::cutree()output matchingdendrogram_plot()) are accepted. Must have exactly one entry per row ofdata(rows with missing values incolsare dropped from both before plotting).- scale
Whether to scale variables to unit variance before clustering and the PCA. Columns with (near-)zero variance cannot be scaled and are dropped with a message, as in
correlation_heatmap().- suggest_k
Optionally choose
kautomatically with a cluster-quality diagnostic instead of using the suppliedk. EitherTRUE(uses the average-silhouette criterion), a string naming the criterion ("silhouette","wss"or"gap"; seek_diagnostic()), orNULL(the default) to leavekunchanged. Ignored whenclustersis supplied.- k_range
Candidate values of
ksearched whensuggest_kis set. The default,NULL, searches1:8for"gap"and"wss"and2:8for"silhouette", ask_diagnostic()does, so the gap statistic can suggest a single cluster.- hulls
Whether to draw a shaded convex hull around each cluster.
- label_centers
Whether to label the cluster centroids.
- point_alpha
Point transparency.
- palette
Colours for the clusters; defaults to
depictr_palette().- title
Plot title.
- seed
Optional integer seed for reproducible k-means (ignored when
clustersis supplied). DefaultNULLleaves the RNG state untouched.- nstart
Number of random starts for
stats::kmeans().- iter.max
Maximum iterations for
stats::kmeans().
Value
A ggplot2::ggplot object. When suggest_k is used, the chosen k
and the full diagnostic are attached as the attribute "k_diagnostic".
See also
k_diagnostic() and silhouette_plot() for cluster-quality
diagnostics.