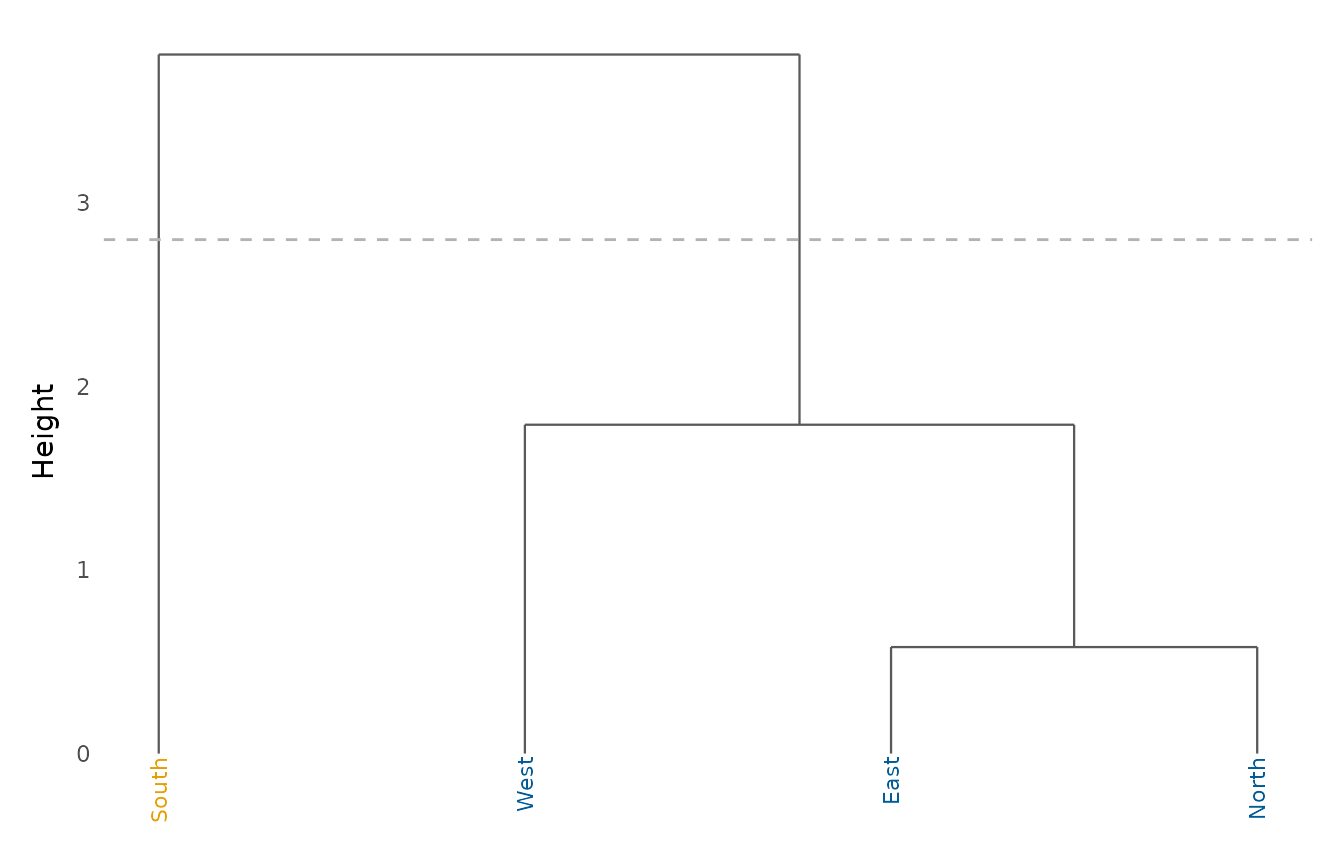
Hierarchical-clustering dendrogram, drawn with ggplot2 so it shares the
package theme. Accepts a data frame (the distance matrix and clustering are
computed for you), a stats::dist object, or an stats::hclust object.
Optionally cut the tree into k clusters, colouring the leaf labels and
drawing the cut height.
Usage
dendrogram_plot(
  x,
  cols = NULL,
  distance = "euclidean",
  method = "complete",
  scale = TRUE,
  k = NULL,
  horizontal = FALSE,
  labels = NULL,
  palette = NULL,
  title = NULL
)
Arguments
- x
A data frame, a
distobject, or anhclustobject.- cols
When
xis a data frame, the numeric columns to use.- distance
Distance measure passed to
stats::dist().- method
Linkage method passed to
stats::hclust().- scale
Whether to scale variables before computing distances (data frame input).
- k
Optional number of clusters to highlight (between 1 and the number of leaves). The cut-height line is drawn only when
2 <= k < n.- horizontal
Whether to draw the tree horizontally.
- labels
Whether to print the leaf labels.
NULL(the default) chooses automatically: labels are shown for small trees (up to 40 leaves) and suppressed for larger ones, where they would otherwise collapse into an unreadable smear.TRUE/FALSEforce them on or off. When labels are hidden andkis set, the cluster membership is instead conveyed by a coloured strip of leaf ticks along the bottom of the tree.- palette
Colours for the
kclusters; defaults todepictr_palette().- title
Plot title.
Value
A ggplot2::ggplot object.