Plots one or more series over time, with an optional moving-average overlay.
The input can be a ts object, a numeric vector or matrix, or a data frame
with a time column, a value column and an optional grouping column. A
multivariate ts, such as cbind(mdeaths, fdeaths), or a matrix with
several columns gives one series per column, named after its column.
Usage
timeseries_plot(
  x,
  time = NULL,
  value = NULL,
  group = NULL,
  rolling = NULL,
  forecast = NULL,
  frequency = NULL,
  level = 0.95,
  lambda = NULL,
  palette = NULL,
  point = FALSE,
  title = NULL,
  x_lab = NULL,
  y_lab = NULL
)
Arguments
- x
A
tsobject, a numeric vector or matrix, or a data frame.- time
When
xis a data frame, the time column (string or unquoted name). Whenxis a numeric vector or matrix, an optional vector of times, one per value or per row.- value
When
xis a data frame, the value column.- group
When
xis a data frame, an optional grouping column mapped to colour. A factor keeps the order of its levels in the legend and the palette, and levels no row uses are left out. Other columns are ordered by first appearance.- rolling
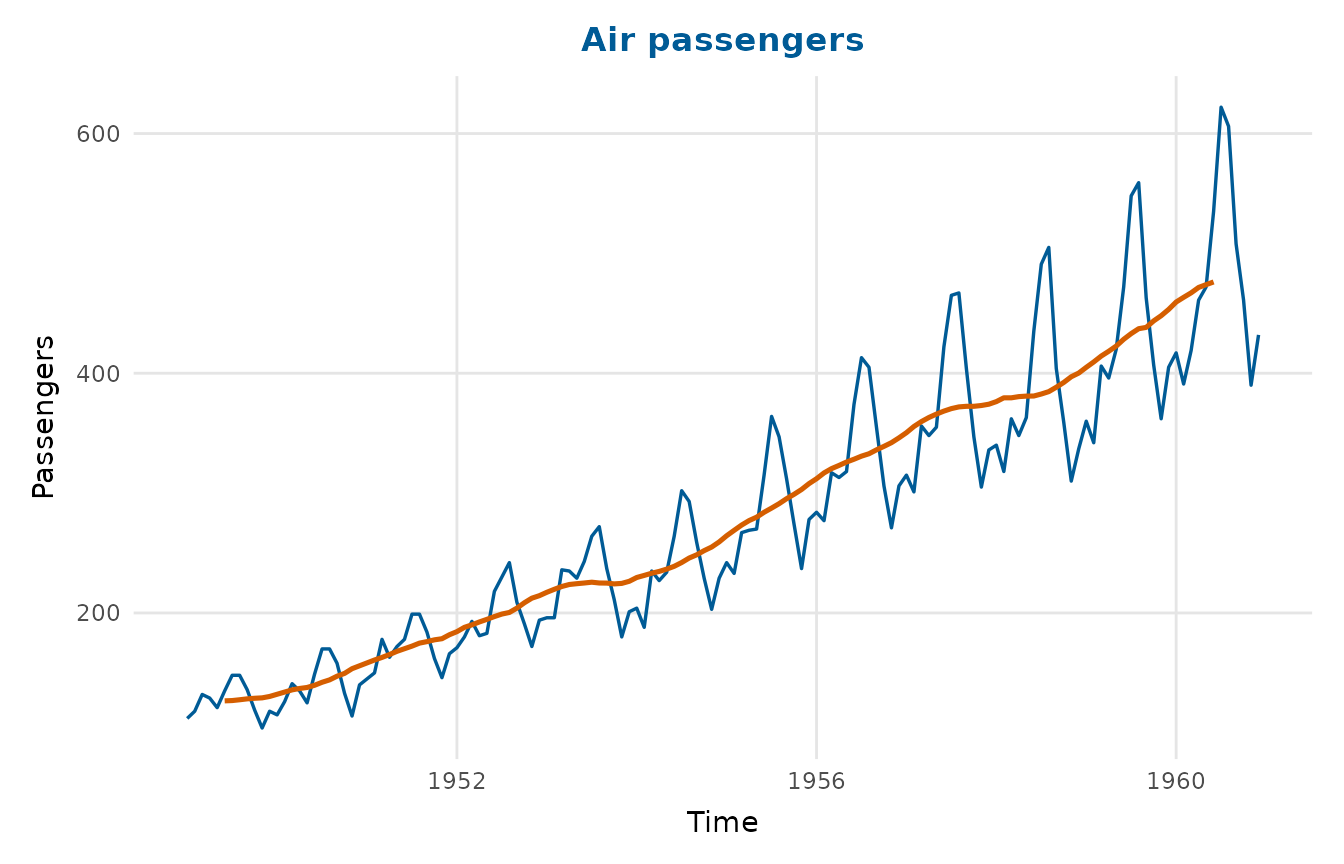
Optional integer window for a centred moving-average overlay. The data are ordered by time (within each group) before the moving average is computed, so unsorted input is handled correctly. An odd window averages each observation with the same number of neighbours on either side. An even window, such as 12 for monthly data, gives the 2×12 moving average, a 12-point average followed by a 2-point one (Hyndman & Athanasopoulos, 2021, Section 3.3). The two observations at the ends of the 13 it spans count half, which centres the average on its observation, as equal weights over an even window cannot. It needs a series one observation longer than the window.
- forecast
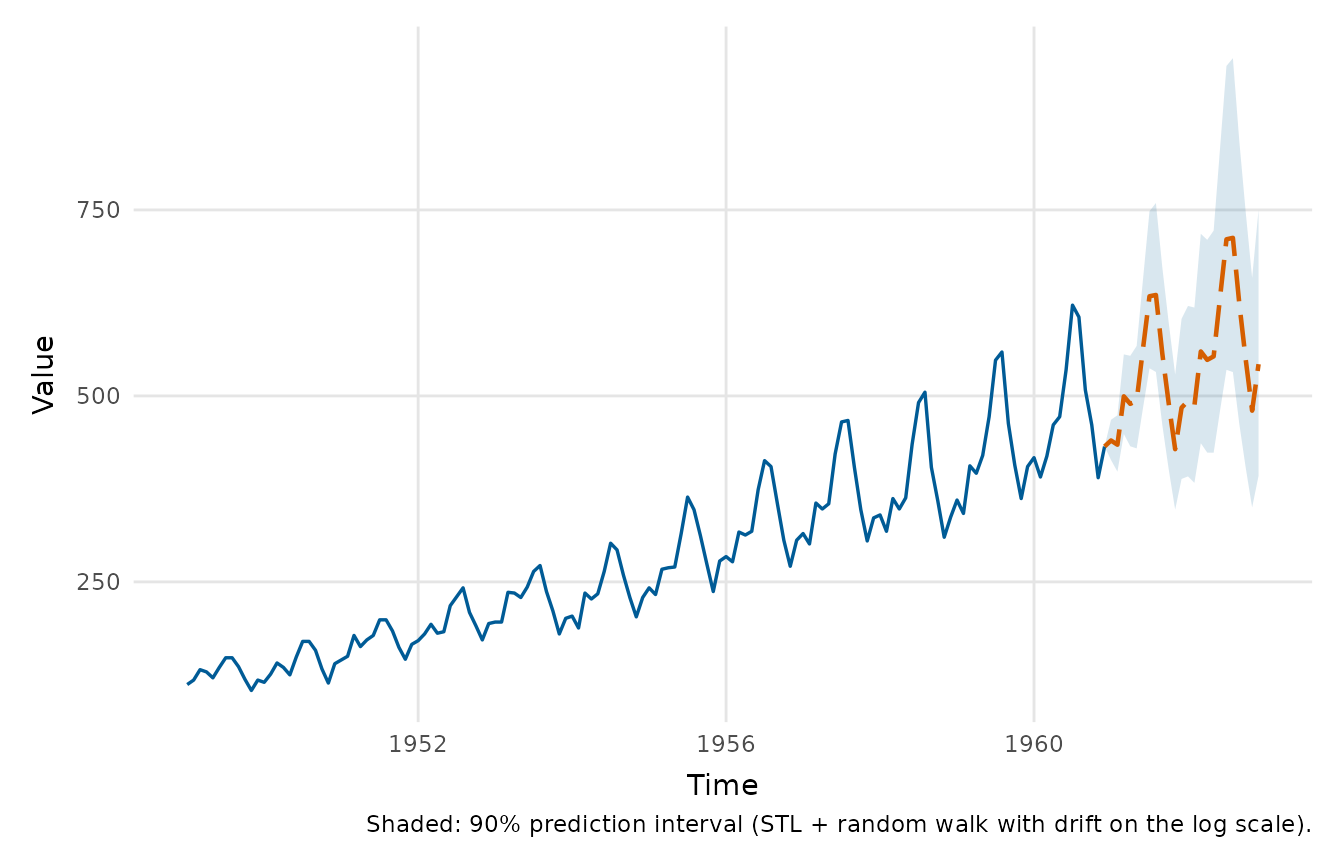
Optional forecast overlay for a single (non-grouped) series. Either an integer horizon (number of future steps) to forecast with the built-in STL plus random walk with drift (see
ts_forecast()), or a pre-computed forecast supplied as a data frame with columnstime,fitand (optionally)lwr/upr, for instance from a fittedforecast::forecast()object. The point forecast continues the line and a shaded prediction-interval ribbon is drawn behind it. The built-in forecast is captioned with its coverage and method, and its band widens with the horizon on the scale it is made on (seelambda). For a numericx, it is made from the values in time order and continues the history's own time axis, one typical step at a time. Missing values at either end of the series are trimmed before forecasting, so the forecast starts from the last observation, and a missing value inside the series is an error.- frequency
Number of observations per period, used only to coerce a numeric
xto atswhen an integerforecasthorizon is requested.- level
Prediction-interval coverage for the built-in forecast (a single number strictly between 0 and 1, e.g.
0.95).- lambda
Optional Box-Cox transformation for the built-in forecast, passed to
ts_forecast().0forecasts on the log scale, which suits a series whose seasonal swing grows with its level.- palette
Colours for the groups; defaults to
depictr_palette().- point
Whether to add points as well as the line.
- title, x_lab, y_lab
Title and axis labels.
Value
A ggplot2::ggplot object.
References
Hyndman RJ, Athanasopoulos G (2021). Forecasting: Principles and practice, 3rd edition. OTexts, Melbourne, Australia. https://otexts.com/fpp3/.
Examples
timeseries_plot(AirPassengers, rolling = 12,
title = "Air passengers", y_lab = "Passengers")
 # One line per column of a multivariate ts
timeseries_plot(cbind(mdeaths, fdeaths), y_lab = "Deaths")
# One line per column of a multivariate ts
timeseries_plot(cbind(mdeaths, fdeaths), y_lab = "Deaths")
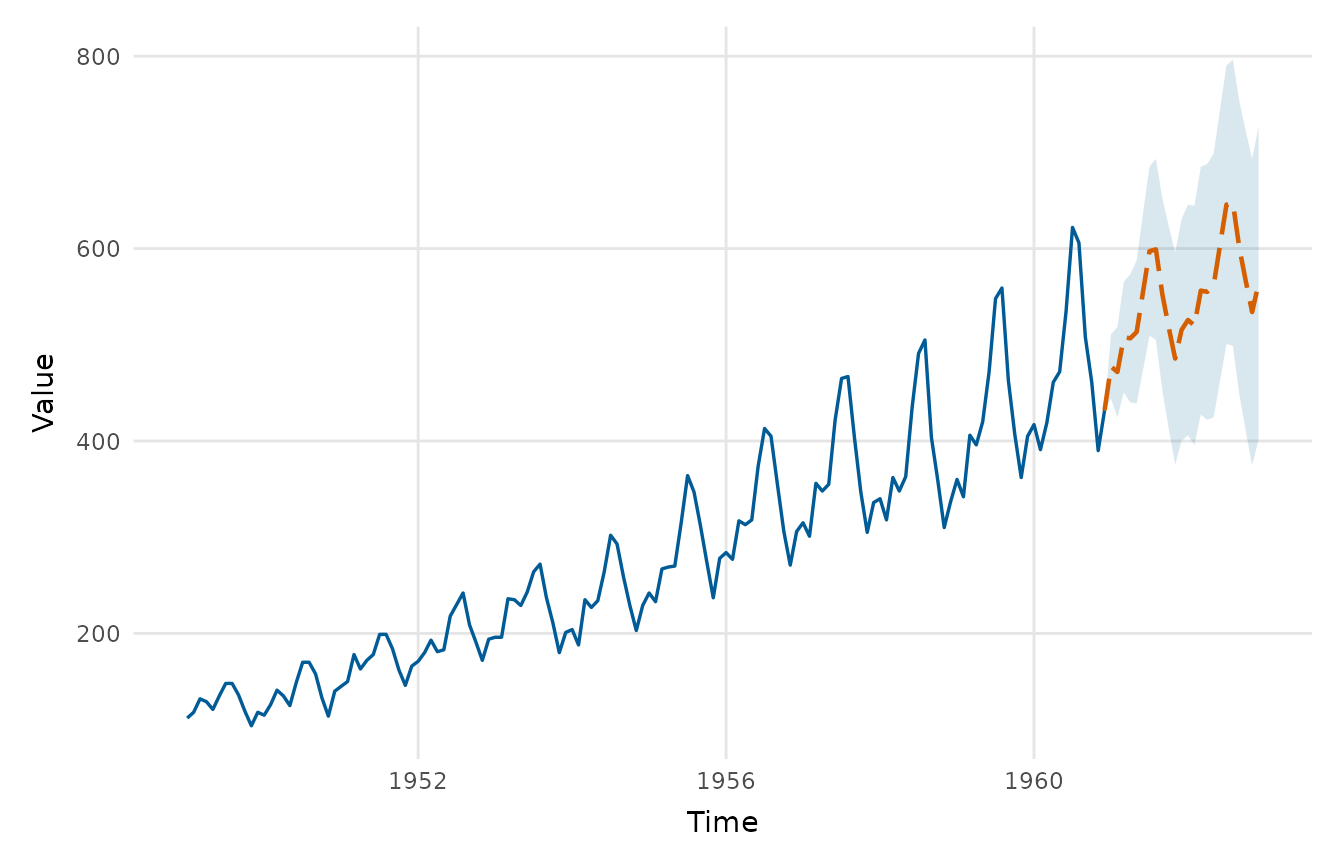 # 24-month forecast with a 90% prediction interval, made on the log scale
# because the seasonal swing grows with the number of passengers
timeseries_plot(AirPassengers, forecast = 24, level = 0.9, lambda = 0)
# 24-month forecast with a 90% prediction interval, made on the log scale
# because the seasonal swing grows with the number of passengers
timeseries_plot(AirPassengers, forecast = 24, level = 0.9, lambda = 0)