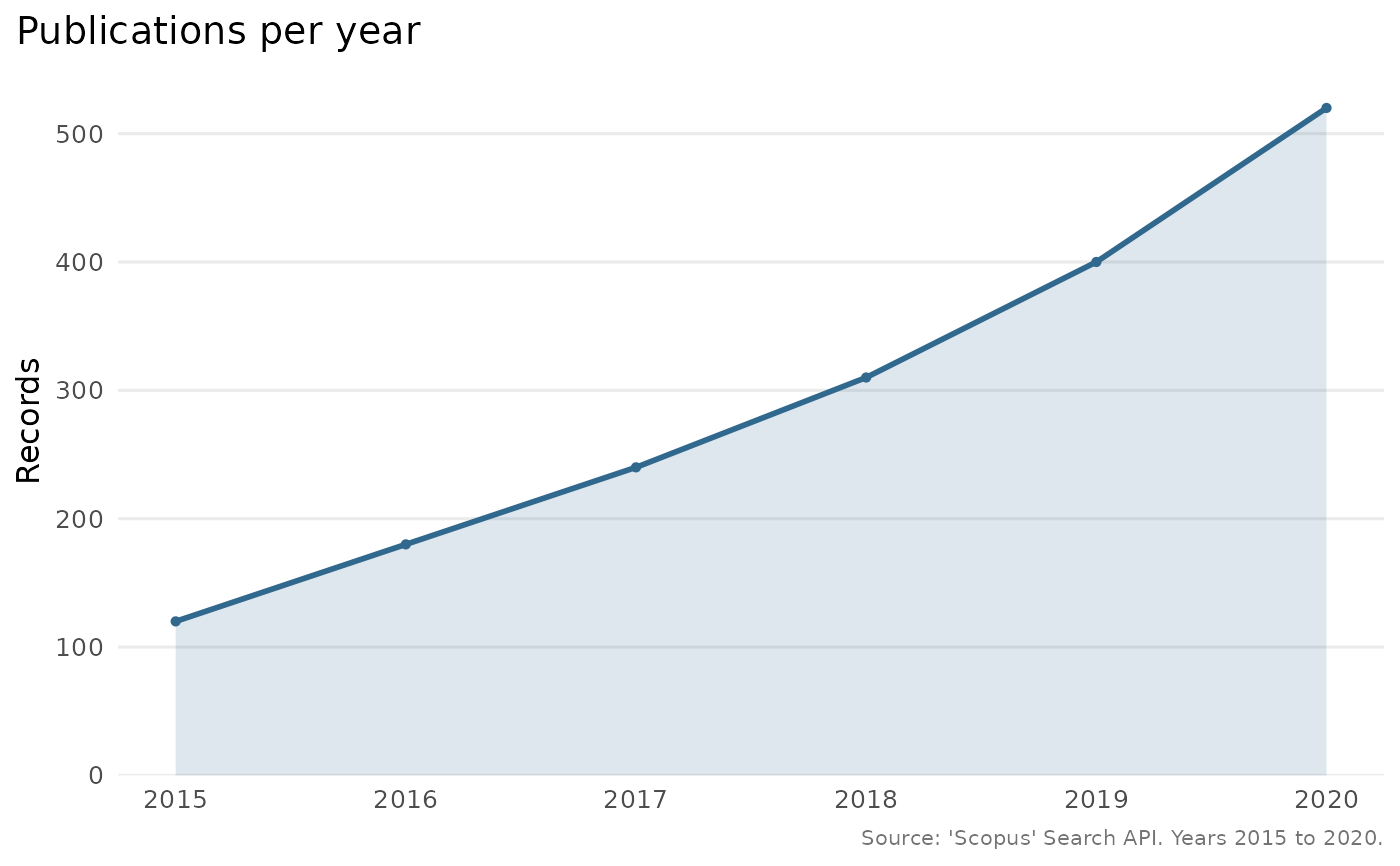
Draws annual record counts over time from the output of scopus_trend().
Arguments
- x
A
scopus_trendobject fromscopus_trend().- ...
Currently unused, present for S3 consistency.
- object
A
scopus_trendobject (for theautoplot()method).
Value
A ggplot2::ggplot object. Needs the suggested package ggplot2.