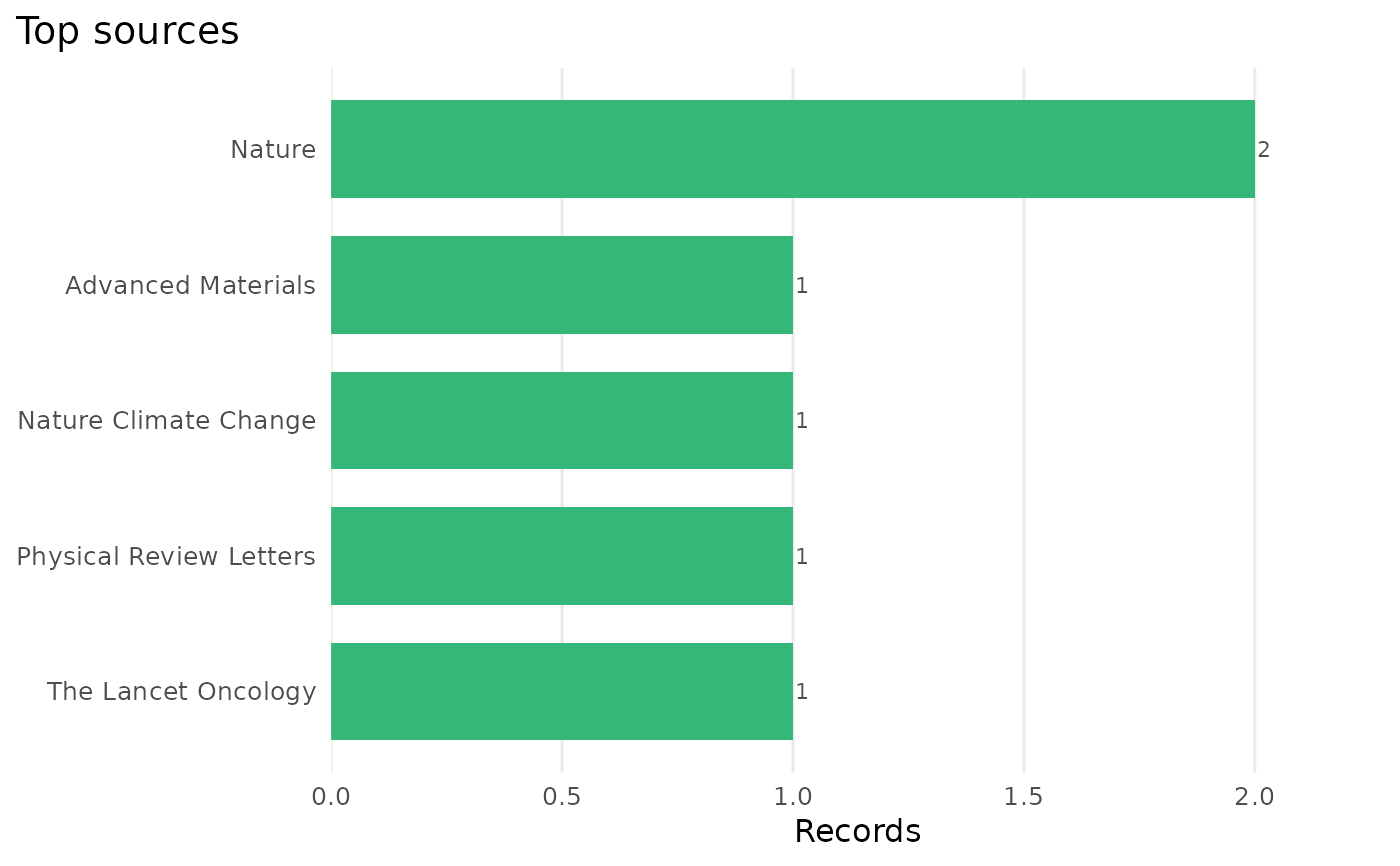
Draws a horizontal bar chart from the output of scopus_top().
Arguments
- x
A
scopus_topobject fromscopus_top().- ...
Currently unused, present for S3 consistency.
- object
A
scopus_topobject (for theautoplot()method).
Value
A ggplot2::ggplot object. Needs the suggested package ggplot2.
Examples
plot_scopus_top(scopus_top(example_records, by = "source"))