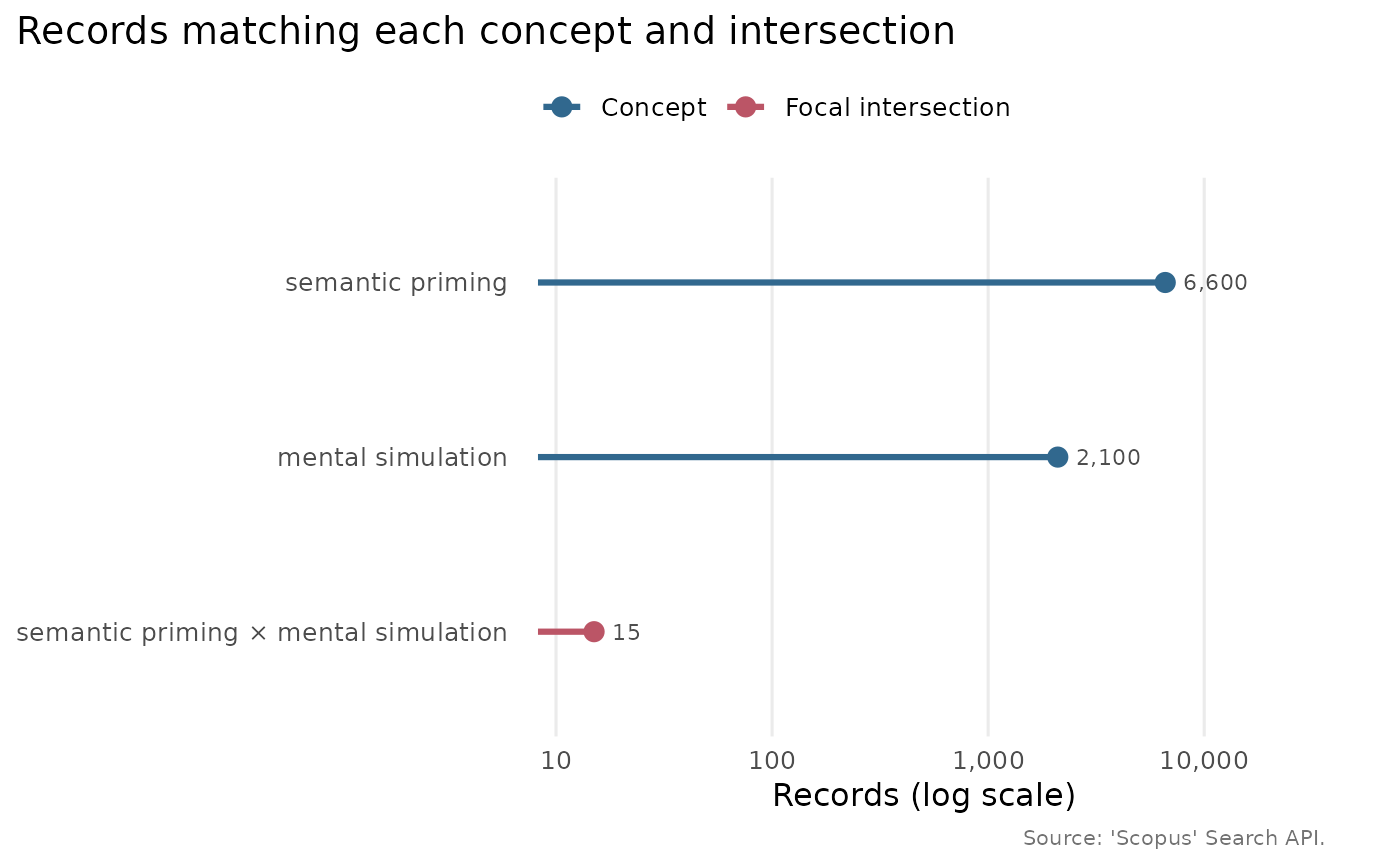
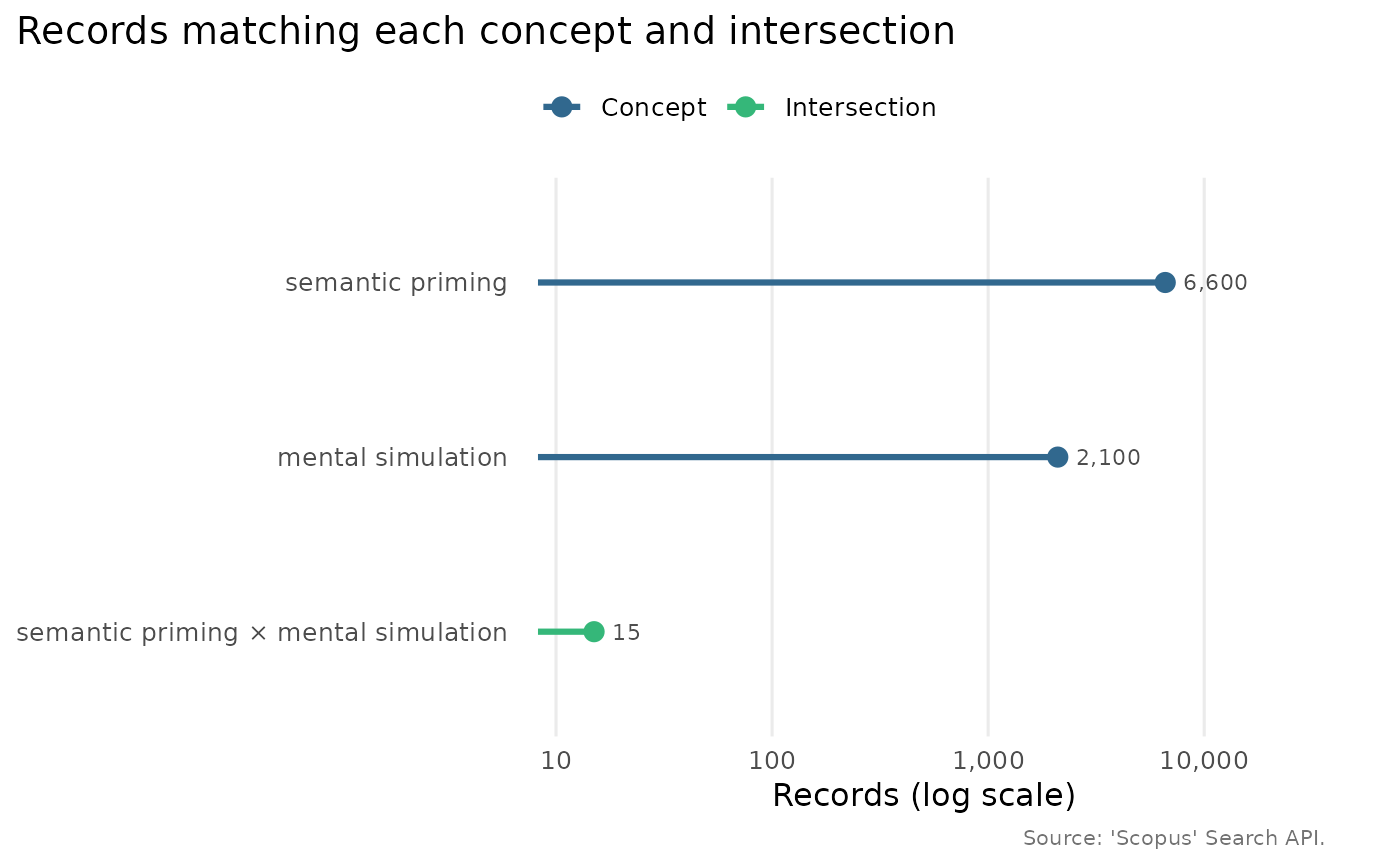
Draws the counts from scopus_intersections() as a lollipop chart on a
log-scale axis, so a niche of a dozen records stays legible beside a parent
literature of many thousands. Rows are ordered by size, with the largest at
the top, and one or more rows can be shown in an accent colour, typically a
study's own niche. The axis range and the gap between each point and its
count label are derived from the data, so the chart reads the same whether
the counts span one order of magnitude or six.
Usage
plot_scopus_intersections(x, highlight = NULL, highlight_label = NULL, ...)

# S3 method for class 'scopus_intersections'
autoplot(object, ...)
Arguments
- x
A
scopus_intersectionsobject fromscopus_intersections().- highlight
Optional character vector of row labels to draw in an accent colour, for example the intersection that defines a study's niche.
- highlight_label
Legend label for the highlighted rows. The default,
NULL, derives the label from what is highlighted: "Focal intersection" when every highlighted row is an intersection, "Focal concept" when every one is a concept, and "Focal set" for a mixture. Supply a string to use that instead.- ...
Currently unused, present for S3 consistency.
- object
A
scopus_intersectionsobject (for theautoplot()method).
Value
A ggplot2::ggplot object. Needs the suggested package ggplot2.
Details
A count of zero cannot be placed on a log axis, so rows whose count is
zero or NA are dropped with a warning, which the caption also notes. An
empty intersection is itself a finding; the printed object keeps the zero
even though the chart cannot.
Examples
sets <- tibble::tibble(
label = c("semantic priming", "mental simulation",
"semantic priming \u00d7 mental simulation"),
query = "q",
n = c(6600, 2100, 15),
type = c("concept", "concept", "intersection"),
size = c(1L, 1L, 2L),
members = c("semantic priming", "mental simulation",
"semantic priming; mental simulation")
)
class(sets) <- c("scopus_intersections", class(sets))
plot_scopus_intersections(sets)
 plot_scopus_intersections(sets, highlight = sets$label[3])