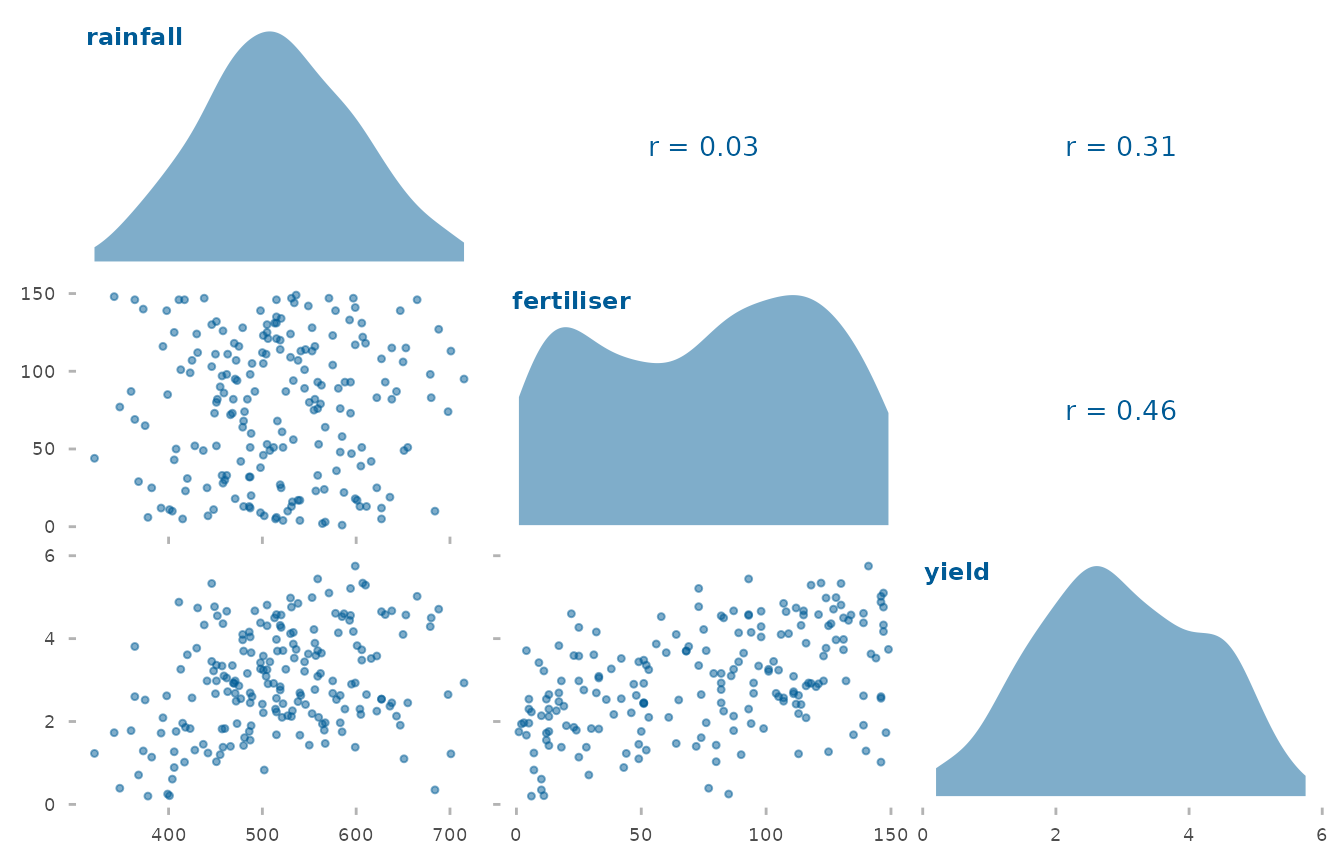
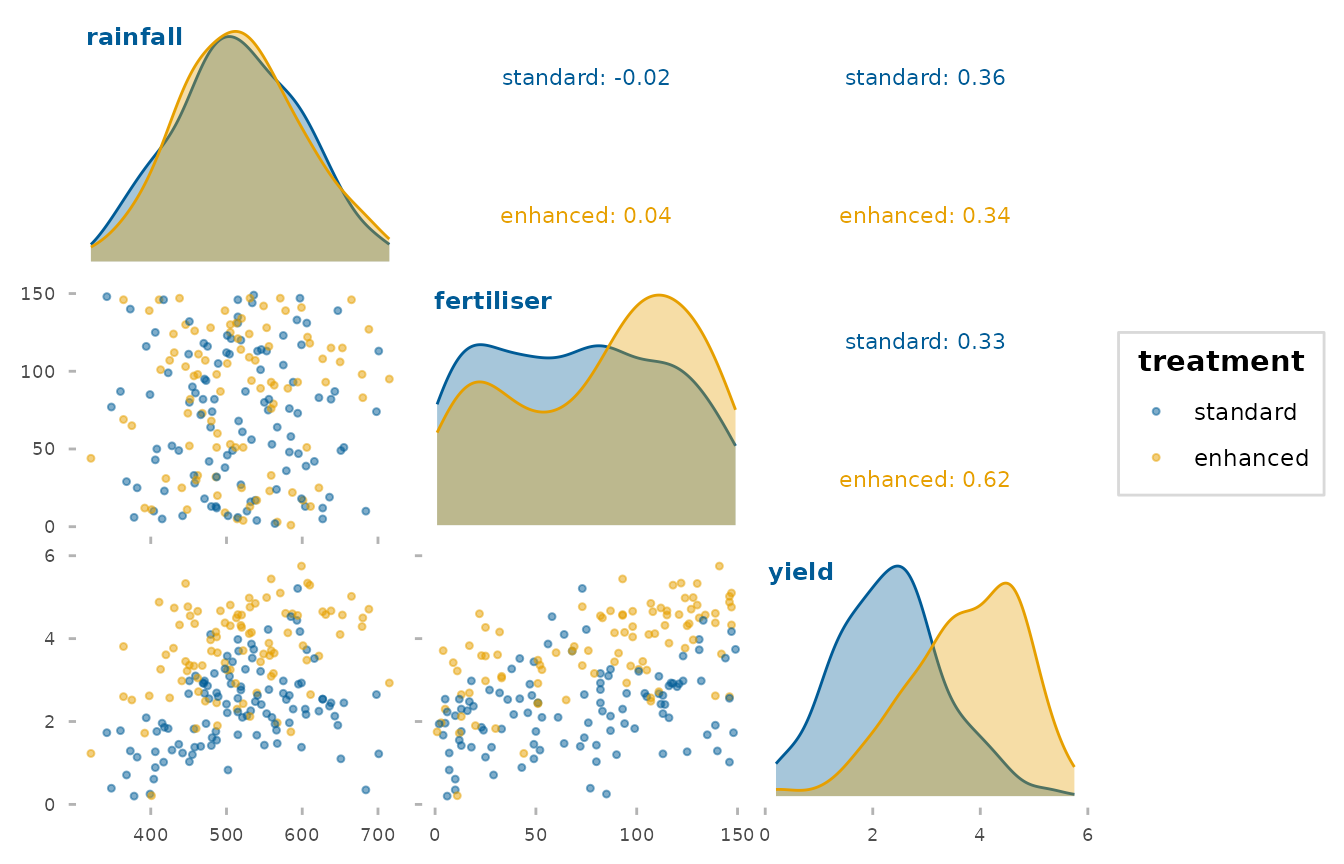
A matrix of pairwise plots for a set of numeric variables: scatter plots below the diagonal, densities on the diagonal and correlation coefficients above the diagonal. Optionally colour everything by a grouping variable. Built with 'patchwork', so it shares the package theme and palette.
Usage
explore_pairs(
  data,
  cols = NULL,
  group = NULL,
  max_cols = 8,
  point_alpha = 0.5,
  method = c("pearson", "spearman", "kendall"),
  palette = NULL,
  title = NULL
)
Arguments
- data
A data frame.
- cols
Numeric columns to include, which cannot include
group. IfNULL, every numeric column other thangroupis used, so a frame with more thanmax_colsof them needscolsto choose among them.- group
Optional grouping variable mapped to colour, with each level in the same colour in every panel. A numeric code counts as a group, but a numeric column with more than 20 distinct values is refused as continuous. Rows with a missing group are dropped with a message, and levels without rows are left out of the plot and its palette.
- max_cols
The largest number of variables accepted, since a k-by-k matrix grows quickly. More columns than this is an error, so the matrix never leaves a variable out without saying so.
- point_alpha
Point transparency in the scatter panels.
- method
Correlation method for the upper-triangle coefficients, passed to
stats::cor():"pearson","spearman"or"kendall". A pair whose correlation is undefined (a constant column, or too few complete cases) is labelledn/a, as incorrelation_heatmap().- palette
Colours for the groups; defaults to
depictr_palette().- title
Overall title for the matrix.
Value
A 'patchwork' object (printable like a ggplot2::ggplot).