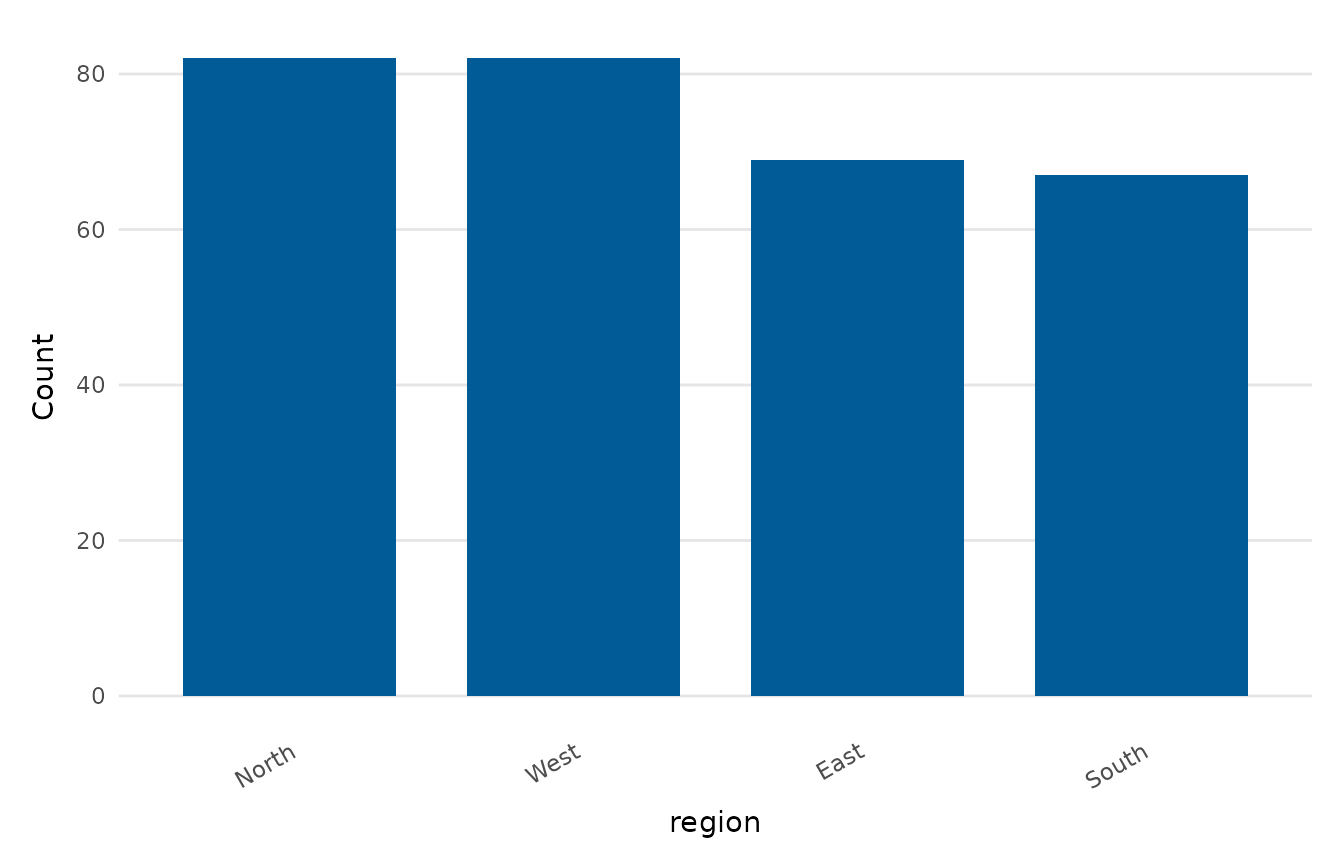
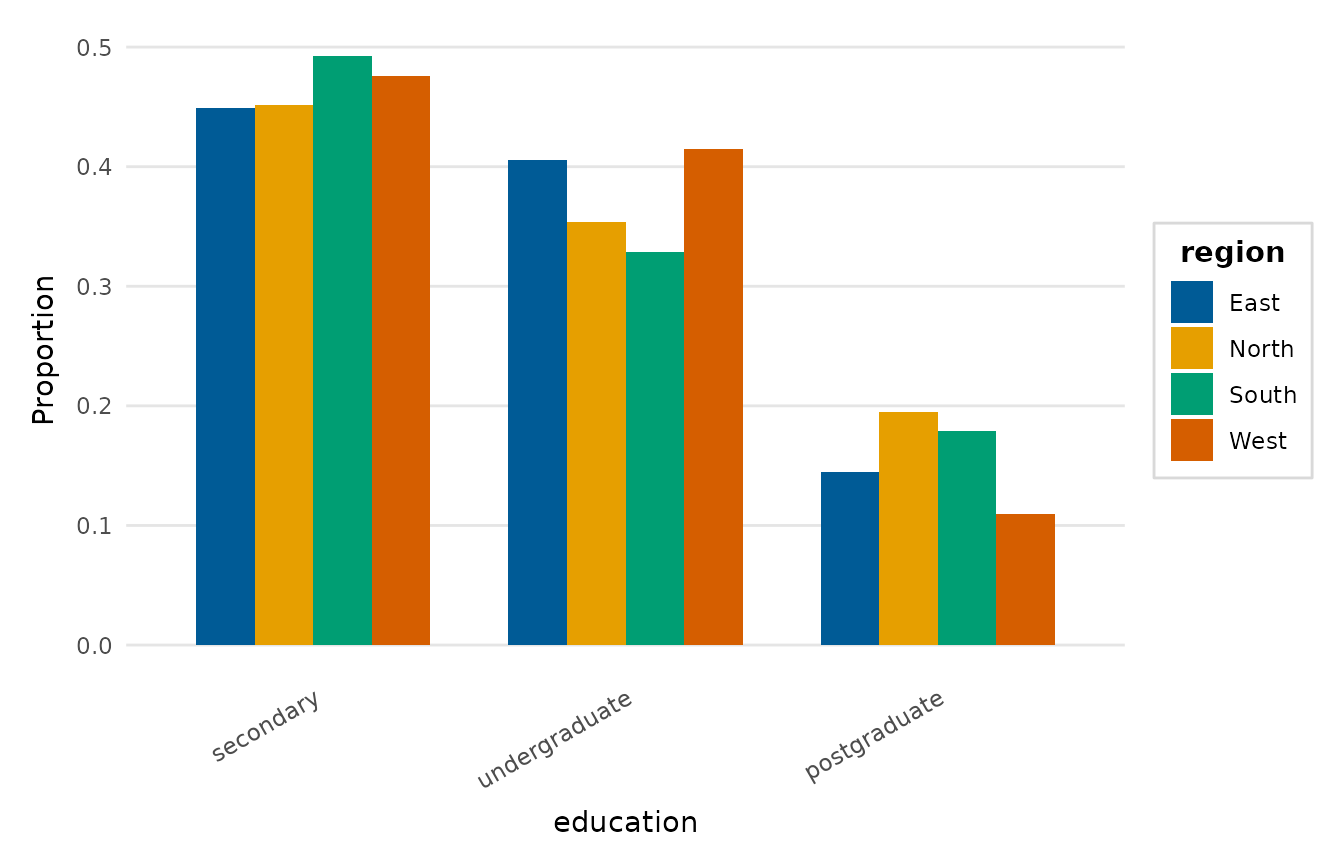
Counts (or proportions) of the levels of a categorical variable, optionally split by a grouping variable.
Usage
explore_categorical(
  data,
  x,
  group = NULL,
  proportion = FALSE,
  position = c("dodge", "stack", "fill"),
  sort = TRUE,
  horizontal = FALSE,
  palette = NULL,
  title = NULL,
  x_lab = NULL
)
Arguments
- data
A data frame.
- x
The categorical variable (string or unquoted name). Numeric columns are accepted only when they have at most 20 distinct values.
- group
Optional grouping variable mapped to fill, with the groups in the order of its levels. A numeric code counts as a group, but a numeric column with more than 20 distinct values is refused as continuous. Rows with a missing group are dropped with a message, and levels without rows are left out of the plot and its palette.
- proportion
Whether to show proportions instead of counts. When
groupis set, proportions are computed within each group.- position
Bar position when
groupis set:"dodge","stack"or"fill".- sort
Whether to order the bars from most to least frequent.
- horizontal
Whether to draw horizontal bars, which helps when there are many levels or long labels.
- palette
Colours for the groups; defaults to
depictr_palette().- title, x_lab
Plot title and category-axis label (defaults to the variable name).
Value
A ggplot2::ggplot object.
Details
A continuous numeric column (more than 20 distinct values) is rejected with
an error, since coercing it to a factor would draw one bar per value; use
explore_distribution() for such variables instead.