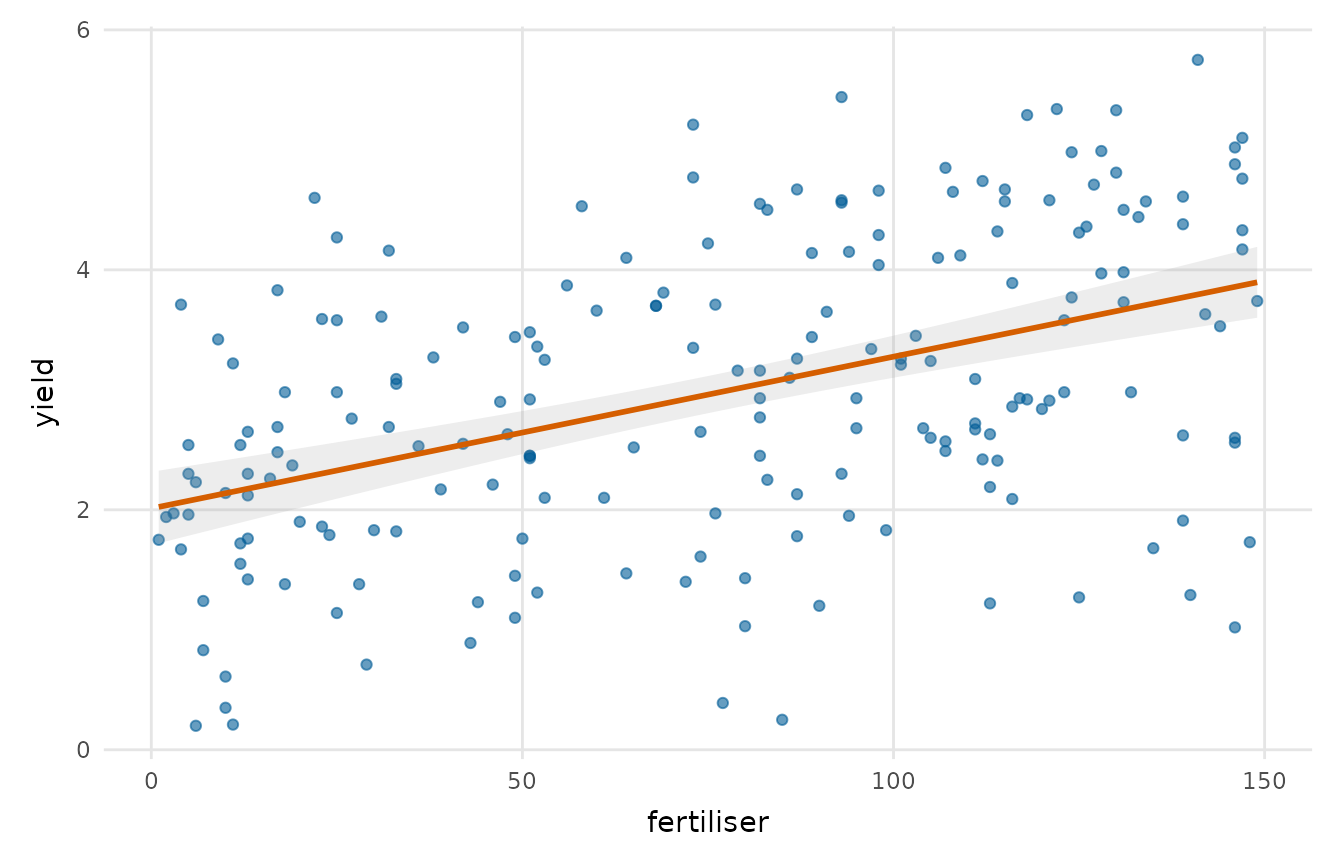
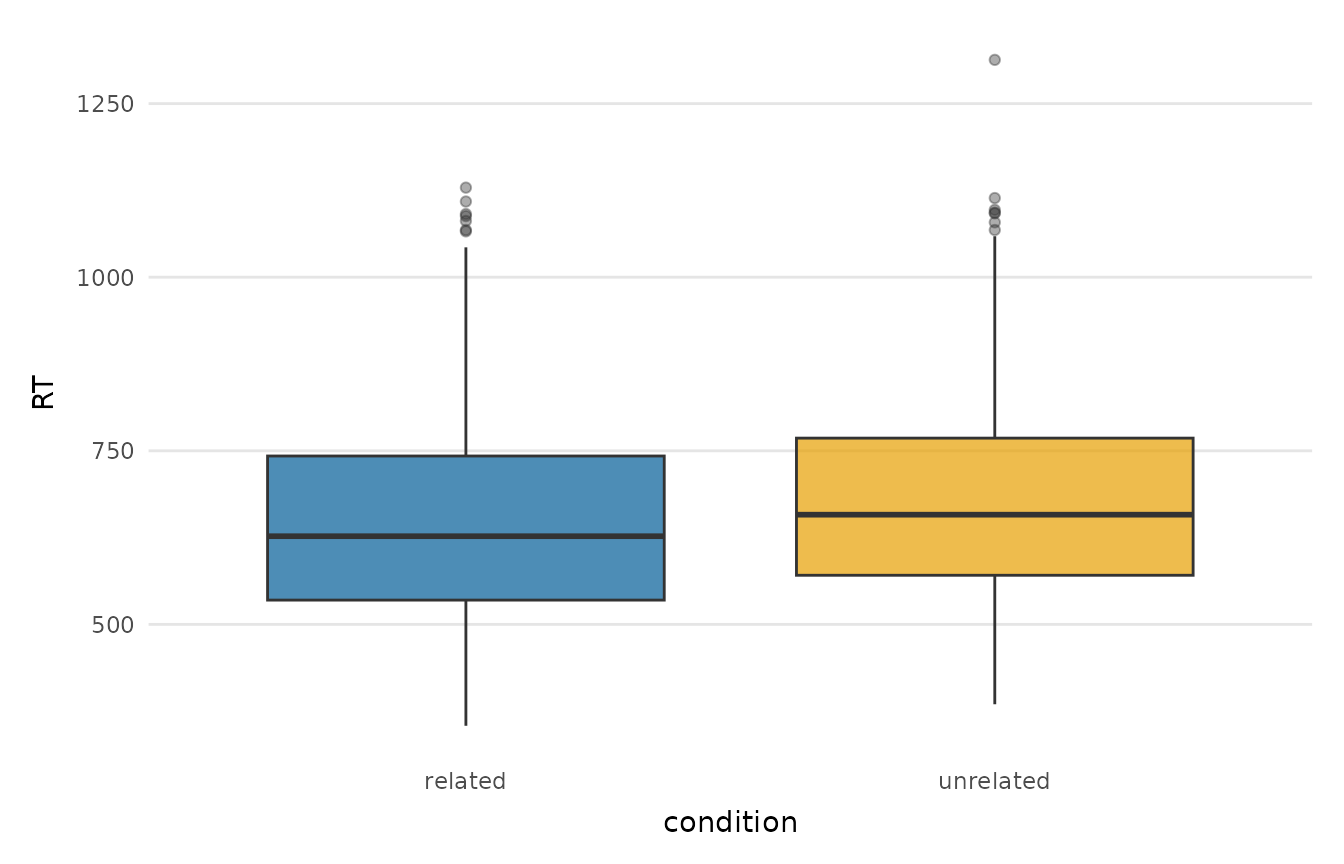
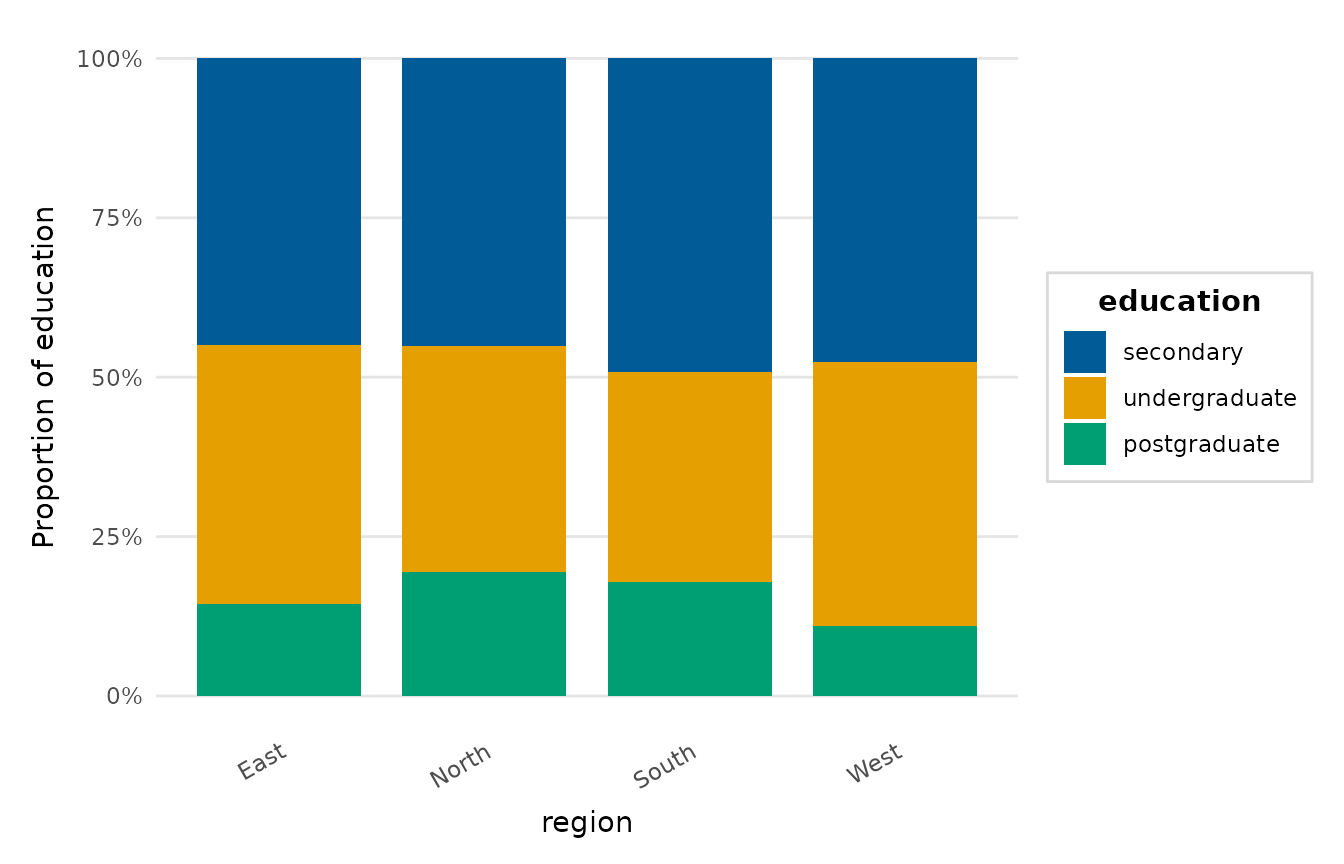
Chooses an appropriate plot for the relationship between two variables according to their types. Two numeric variables are shown as a scatter plot with a fitted trend; a numeric and a categorical variable as box plots of the numeric variable by level; and two categorical variables as a filled bar chart of proportions.
Usage
explore_bivariate(
  data,
  x,
  y,
  method = "lm",
  palette = NULL,
  title = NULL,
  x_lab = NULL,
  y_lab = NULL
)
Arguments
- data
A data frame.
- x, y
The two variables (string or unquoted name).
- method
Smoothing method for the numeric-numeric case (passed to
ggplot2::geom_smooth());NULLfor no trend.- palette
Colours used when a fill/colour is needed; defaults to
depictr_palette().- title, x_lab, y_lab
Title and axis labels (default to variable names).
Value
A ggplot2::ggplot object.
Details
Dates, date-times and durations (Date, POSIXct and difftime columns)
count as numeric. Against a numeric variable, they give a scatter plot with
a trend, drawn by scatter_trend(), and against a categorical one box plots
of their values by level. A duration is drawn as a number in its own units,
named in the default axis title, as in stay (days).