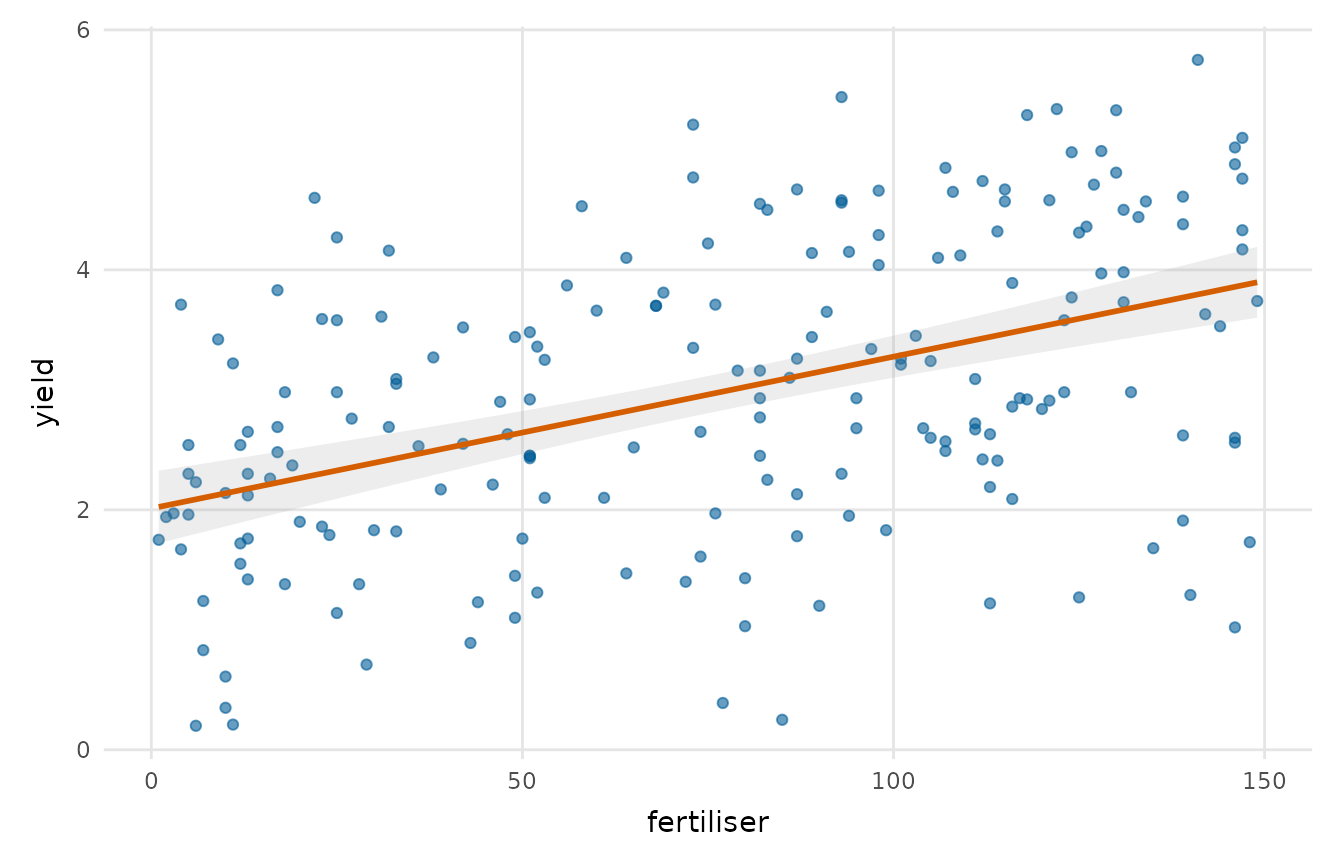
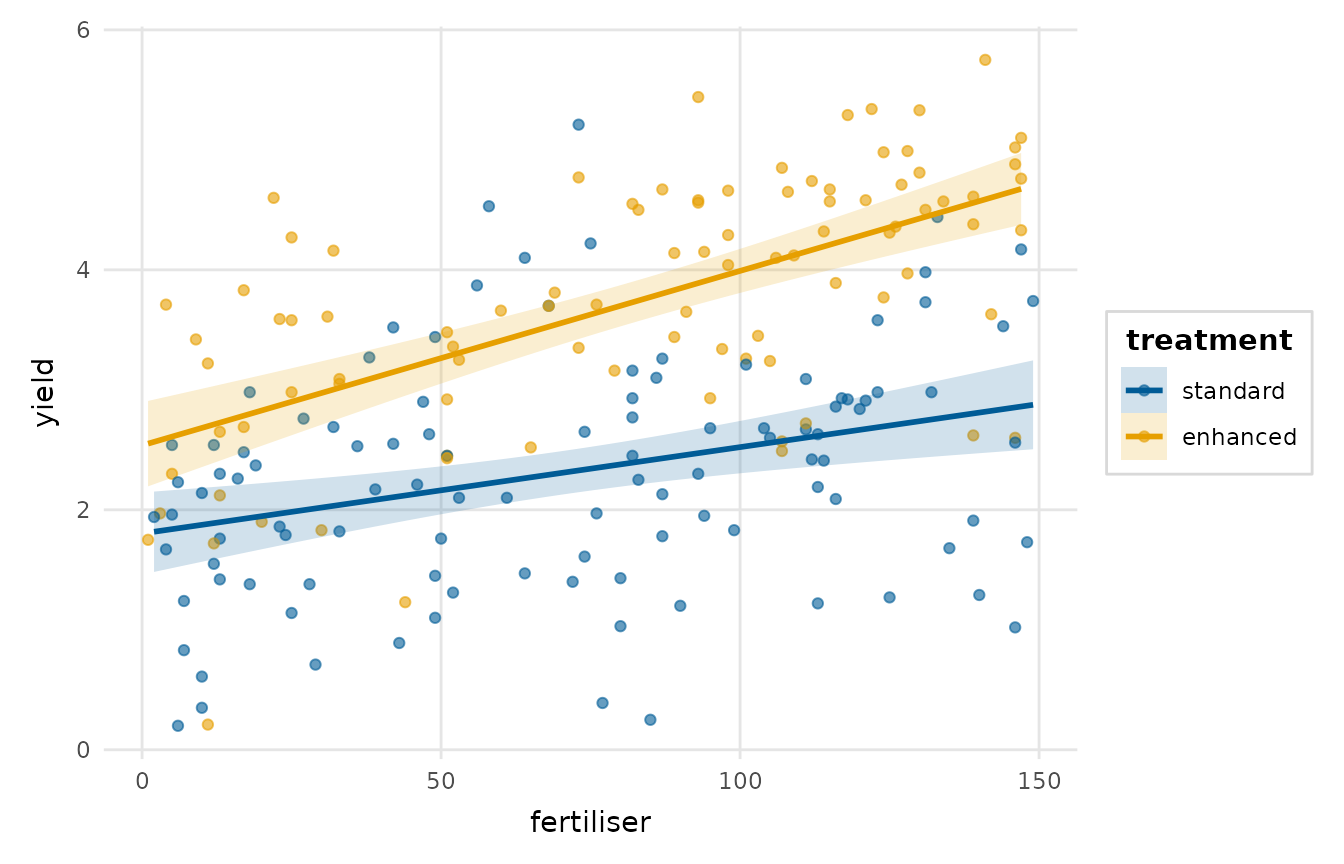
Plots y against x with an optional fitted trend line and confidence
band, optionally split by a grouping variable.
Usage
scatter_trend(
  data,
  x,
  y,
  group = NULL,
  method = "lm",
  se = TRUE,
  point_alpha = 0.6,
  palette = NULL,
  title = NULL,
  x_lab = NULL,
  y_lab = NULL
)
Arguments
- data
A data frame.
- x, y
The variables for the horizontal and vertical axes (string or unquoted column name).
- group
Optional grouping variable mapped to colour. A numeric code counts as a group, but a numeric column with more than 20 distinct values is refused as continuous. Rows with a missing group are dropped with a message, and levels without rows are left out of the plot and its palette.
- method
Smoothing method passed to
ggplot2::geom_smooth(), e.g."lm","loess", orNULLfor no trend line.- se
Whether to draw the confidence band around the trend.
- point_alpha
Point transparency.
- palette
Colours for the groups; defaults to
depictr_palette().- title, x_lab, y_lab
Title and axis labels (default to variable names).
Value
A ggplot2::ggplot object.