Overlays the estimates from two or more models (or tidy estimate tables) on a
single forest plot, with one colour per source. It is the general engine
behind frequentist_bayesian_plot() (frequentist against Bayesian), and
serves equally well for comparing nested models, several optimisers, or
estimates before and after a transformation.
Usage
compare_models(
  ...,
  names = NULL,
  conf_level = 0.95,
  intercept = FALSE,
  order = c("none", "ascending", "descending"),
  labels = NULL,
  interaction = c("times", "asterisk", "colon", "space"),
  dodge_width = 0.6,
  reference_line = if (exponentiate) 1 else 0,
  palette = NULL,
  point_size = 2.2,
  line_size = 0.7,
  facet = FALSE,
  scales = c("fixed", "free"),
  exponentiate = FALSE,
  legend_title = "Source",
  legend_ncol = 1,
  title = NULL,
  subtitle = NULL,
  x_lab = NULL
)
Arguments
- ...
Two or more fitted models and/or tidy data frames of estimates. Name the arguments to label the sources (e.g.
compare_models(Frequentist = m1, Bayesian = m2)).- names
Optional character vector of source labels, overriding the names of
....- conf_level
Confidence/credible level for models, a single number strictly between 0 and 1.
- intercept
Whether to keep the intercept term. Defaults to
FALSE.- order
Order of the terms, by their average estimate across sources.
"ascending"puts the smallest estimate at the bottom and the largest at the top, so estimates increase up the axis."descending"does the reverse, and"none"keeps the terms in the order they first appear, from top to bottom. The faceted layout (facet = TRUE) stacks its panels the other way up.- labels
Optional display labels. An unnamed vector gives one label per term, whatever
orderis. The terms are taken in the order they first appear across the sources, each source in the ordertidy_estimates()returns, after the intercept is dropped unlessintercept = TRUE. Terms drawn on one row, such asstressand brms'sb_stress, take one label. A named vector mapping raw term names to labels, such asc(soil_ph = "Soil pH"), is safer. IfNULL, the terms are labelled as incoefficient_plot(), each factor level with its variable and level (treatment: enhanced), from every fitted model among the sources.- interaction
Passed to
format_terms().- dodge_width
Vertical spacing between sources sharing a term.
- reference_line
Position of a vertical reference line. Defaults to 0, or to 1 when
exponentiate = TRUE. UseNAto omit it.- palette
Colours for the sources; defaults to
depictr_palette().- point_size, line_size
Point and interval-line sizes.
- facet
Whether to give each term its own panel with a free x-axis, laid out one per row, so that terms on very different scales (for example a large intercept alongside small slopes) stay legible. The source overlay and its single legend are preserved within the faceted layout. Defaults to
FALSE. A convenience alias forscales = "free".- scales
Either
"fixed"(the default, a single shared x-axis) or"free"(one free-scaled panel per term). Whenfacet = TRUEthis is forced to"free".- exponentiate
Whether to draw every source's exponentiated estimates and intervals on a log10 axis, as odds or rate ratios. Each model is exponentiated by
tidy_estimates(), and a data frame among the sources must hold estimates on the link scale, since it is exponentiated too. Defaults toFALSE.- legend_title, legend_ncol
Legend title and number of columns.
- title, subtitle, x_lab
Title, subtitle and x-axis label.
x_labdefaults to "Estimate". Withexponentiate = TRUEit defaults to the name of the ratio, as incoefficient_plot(), when the fitted models agree on it, and to "exp(Estimate)" when they do not.
Value
A ggplot2::ggplot object.
Examples
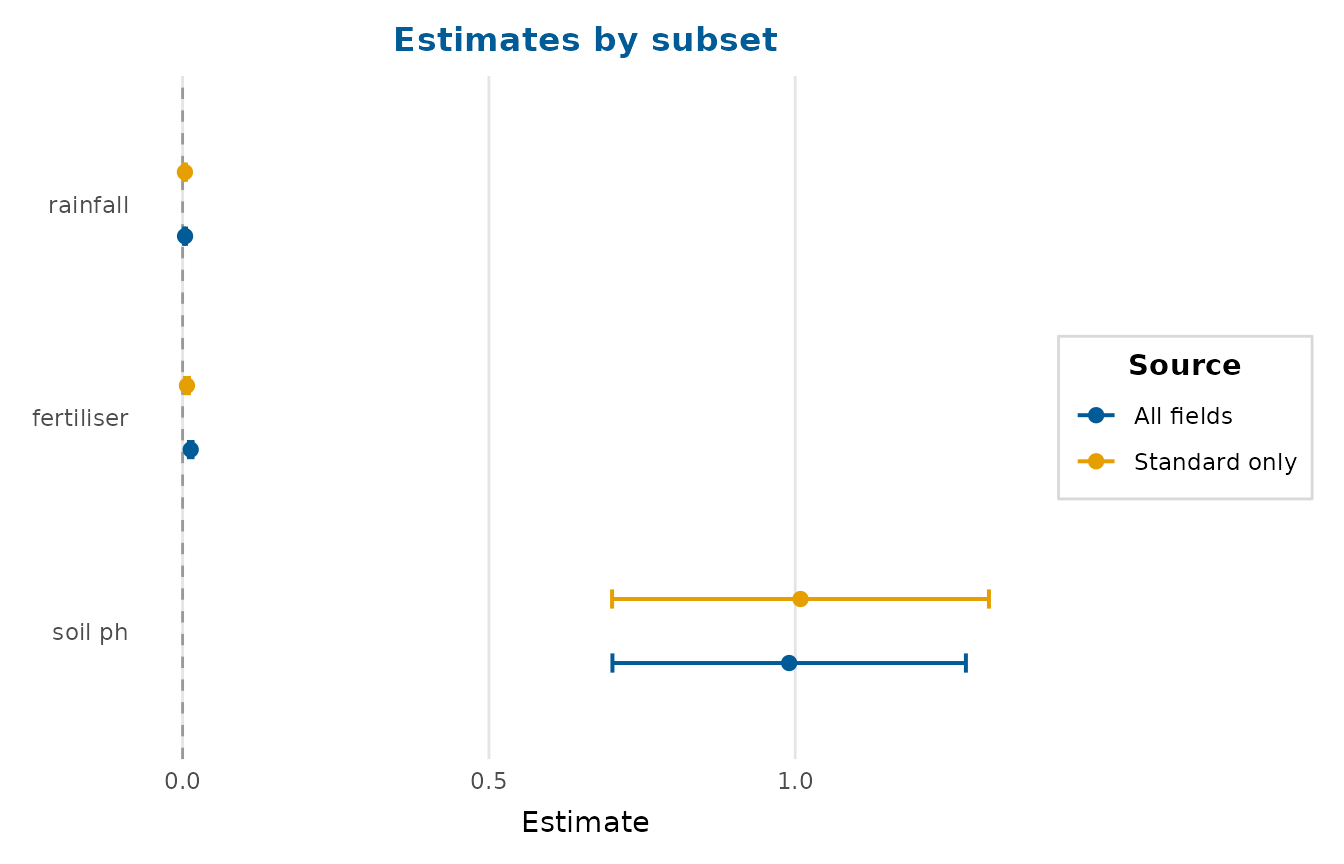
m1 <- lm(yield ~ rainfall + fertiliser + soil_ph, data = crop_yield)
m2 <- lm(yield ~ rainfall + fertiliser + soil_ph,
data = crop_yield[crop_yield$treatment == "standard", ])
compare_models(`All fields` = m1, `Standard only` = m2,
title = "Estimates by subset")
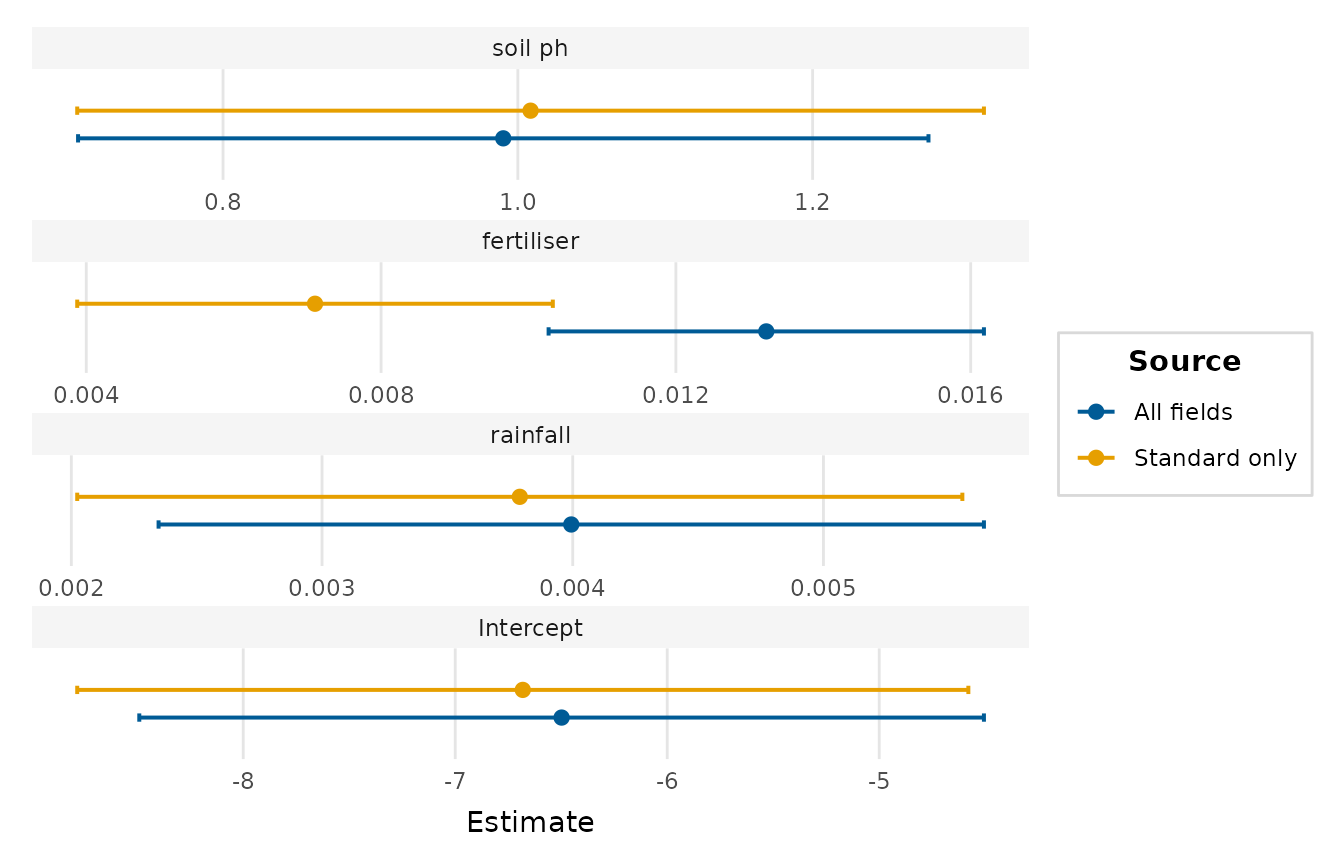
 # Keep the intercept legible alongside the slopes:
compare_models(`All fields` = m1, `Standard only` = m2,
intercept = TRUE, facet = TRUE)
# Keep the intercept legible alongside the slopes:
compare_models(`All fields` = m1, `Standard only` = m2,
intercept = TRUE, facet = TRUE)
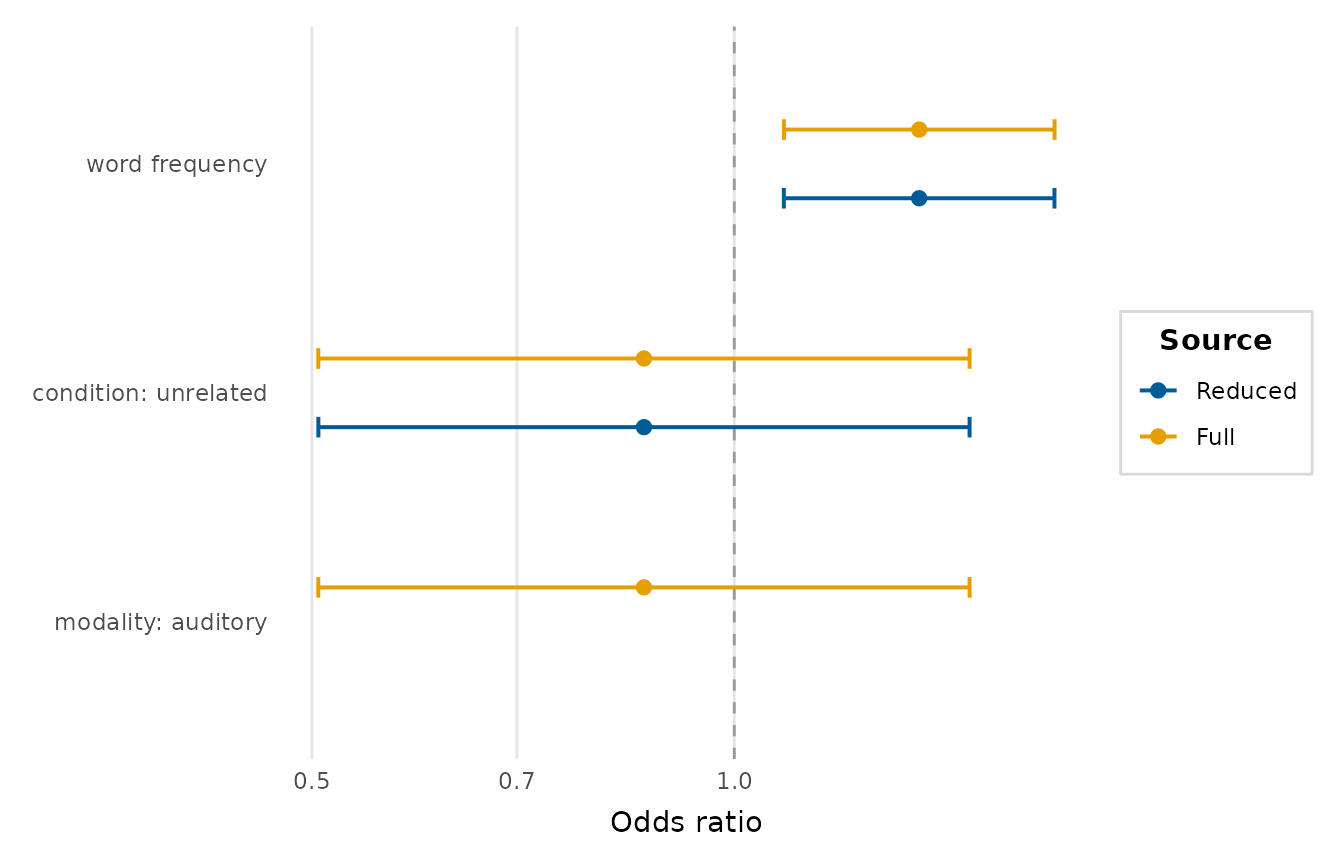
 # Odds ratios from two logistic regressions:
g1 <- glm(accuracy ~ word_frequency + condition,
data = lexical_decision, family = binomial)
g2 <- glm(accuracy ~ word_frequency + condition + modality,
data = lexical_decision, family = binomial)
compare_models(Reduced = g1, Full = g2, exponentiate = TRUE)
# Odds ratios from two logistic regressions:
g1 <- glm(accuracy ~ word_frequency + condition,
data = lexical_decision, family = binomial)
g2 <- glm(accuracy ~ word_frequency + condition + modality,
data = lexical_decision, family = binomial)
compare_models(Reduced = g1, Full = g2, exponentiate = TRUE)