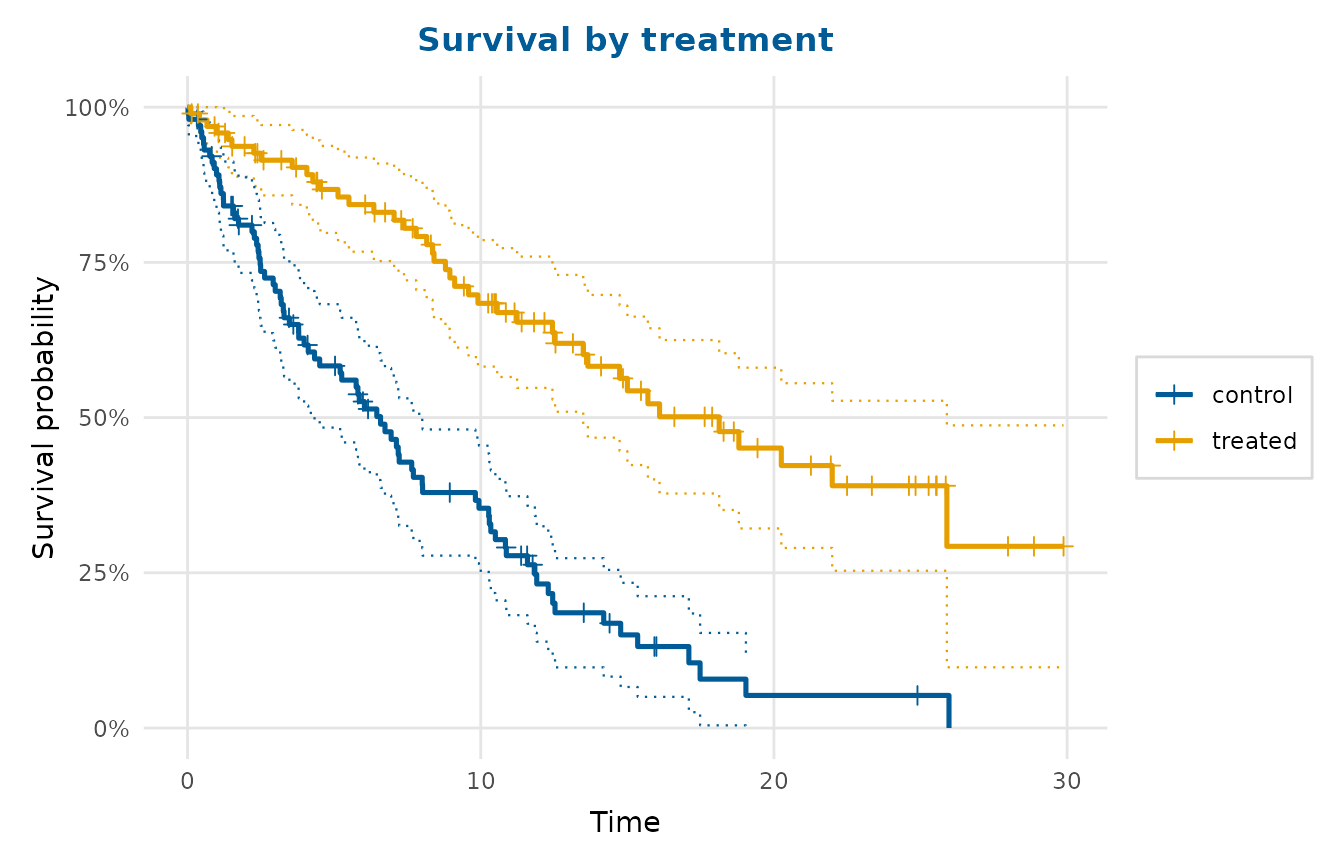
Draws Kaplan-Meier survival curves, optionally by group, with stepwise
confidence limits and censoring marks. The Kaplan-Meier estimate and its
Greenwood standard error are computed with base R, so no modelling package is
required; a survfit object from the 'survival' package is also accepted.
Usage
survival_plot(
  time,
  status = NULL,
  group = NULL,
  conf_level = 0.95,
  censor_marks = TRUE,
  risk_table = FALSE,
  median_line = FALSE,
  logrank = FALSE,
  risk_breaks = NULL,
  palette = NULL,
  legend_inside = FALSE,
  title = NULL,
  x_lab = "Time",
  y_lab = "Survival probability",
  conf_type = c("log-log", "log", "plain")
)
Arguments
- time
A numeric vector of follow-up times, a data frame with
time,statusand optionalgroupcolumns, or asurvfitobject. Every time must be finite: a missing or infinite one is an error rather than a silent exclusion, since dropping it would move the number at risk unannounced.- status
Event indicator: a vector, or a column name when
timeis a data frame (by default itsstatusoreventcolumn). Either the 0/1 convention (0= censored,1= event) or thesurvival::Surv()1/2 convention (1= censored,2= event) is accepted, read over all groups together; logical values are also allowed. Other codings raise an error, among them a code that is not a whole number and a factor or character indicator, whose values do not say which one is the event. Observations whose status is missing are dropped with a message, since they record neither an event nor a censoring.- group
Optional grouping variable: a vector, or a column name when
timeis a data frame (by default itsgroup,strataorarmcolumn, if any). Observations whose group is missing are dropped with a message, since they belong to no arm.- conf_level
Confidence level for the limits, a single number strictly between 0 and 1 (
NAto omit them). For asurvfitobject, the limits are recomputed at this level, even for one made withconf.type = "none", since it keeps its standard errors. An object that stores no standard errors, or whose lower limits followconf.lower = "peto"or"modified", keeps the limits it holds, with a warning when they are not the ones asked for.- censor_marks
Whether to mark censoring times with a
+.- risk_table
Whether to add a number-at-risk table beneath the curves (composed with 'patchwork'). Defaults to
FALSE.- median_line
Whether to draw dashed guides to each group's median survival time and label it. Defaults to
FALSE.- logrank
Whether to add a log-rank test of the group difference as a subtitle (two or more groups only). Defaults to
FALSE.- risk_breaks
Optional numeric vector of times at which to report the number at risk. Defaults to the curve's x-axis breaks.
- palette
Colours for the groups; defaults to
depictr_palette().- legend_inside
When
TRUE(and there are several groups), draw the group legend inside the panel (in the bottom-left corner a monotone-decreasing survival curve always leaves empty) over a translucent background, instead of in a right-hand margin. Defaults toFALSE.- title, x_lab, y_lab
Title and axis labels.
- conf_type
The scale on which the confidence limits are built:
"log-log"(the default),"log"or"plain", as set out under Details.
Value
A ggplot2::ggplot object or, when risk_table = TRUE, a
'patchwork' object stacking the curves above the risk table.
Details
The confidence limits are pointwise. By default, they are built on the
log-log scale, as
\(S^{\exp(\pm z \sigma / \log S)}\),
where \(\sigma\) is the Greenwood standard error of
\(\log S\). These limits stay between 0 and 1, and in small
samples they cover better than the untransformed limits
\(S \pm z S \sigma\) (Borgan & Liestøl, 1990).
conf_type = "plain" draws the untransformed limits, clipped to that range,
and conf_type = "log" draws
\(S \exp(\pm z \sigma)\),
capped at 1, as survival::survfit() does by default. The limits are 1
while the estimate is 1, and where a curve falls to 0, they keep the values
of the step before. The limits of a survfit object are recomputed from its
standard errors at conf_level and conf_type, so they equal those that
survfit() gives with the same conf.int and conf.type (conf_level
names the objects that keep their own).
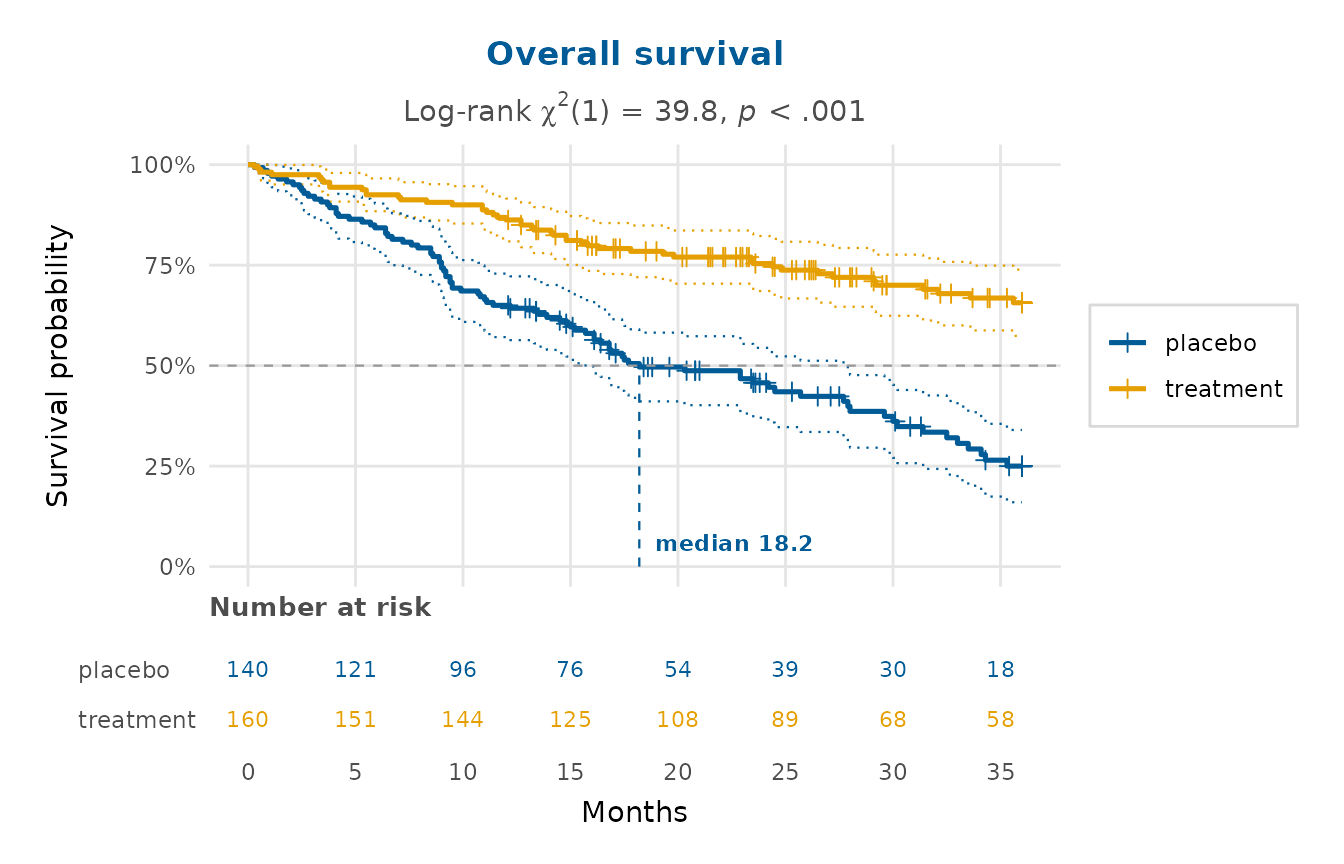
For publication-ready figures the plot offers the three annotations that define a "survminer-style" Kaplan-Meier display, each behind its own argument and off by default:
Number-at-risk table (
risk_table = TRUE): a small panel composed beneath the curves with 'patchwork', giving the number of subjects still at risk in each group at the x-axis breaks.Median-survival guides (
median_line = TRUE): dashed reference lines from the 0.5 survival level down to each group's median survival time, with the median value labelled. The median is the time at which the curve falls below 0.5. Where the curve stays at 0.5 until a later drop, or until its last time, the median is the midpoint of that stretch, as insurvival::quantile.survfit(). Groups whose curve never reaches 0.5 (median not estimable) are skipped.Log-rank test (
logrank = TRUE): for two or more groups, the chi-squared log-rank statistic and its p-value are added as a subtitle.survival::survdiff()is used when the 'survival' package is installed, otherwise an equivalent base-R log-rank test is computed from the risk/event tables.
References
Kaplan EL, Meier P (1958). “Nonparametric estimation from incomplete observations.” Journal of the American Statistical Association, 53(282), 457–481. doi:10.1080/01621459.1958.10501452 .
Greenwood M (1926). The natural duration of cancer, volume 33 of Reports on Public Health and Medical Subjects. His Majesty's Stationery Office, London.
Borgan Ø, Liestøl K (1990). “A note on confidence intervals and bands for the survival function based on transformations.” Scandinavian Journal of Statistics, 17(1), 35–41.
Mantel N (1966). “Evaluation of survival data and two new rank order statistics arising in its consideration.” Cancer Chemotherapy Reports, 50(3), 163–170.
Examples
set.seed(1)
n <- 200
grp <- sample(c("control", "treated"), n, replace = TRUE)
time <- rexp(n, rate = ifelse(grp == "treated", 0.05, 0.1))
cens <- runif(n, 0, 30)
obs <- pmin(time, cens)
event <- as.integer(time <= cens)
survival_plot(obs, event, group = grp, title = "Survival by treatment")
 # survminer-style figure: risk table, median guides and a log-rank test
data(clinical_trial)
survival_plot(clinical_trial$time, clinical_trial$event,
group = clinical_trial$arm, risk_table = TRUE,
median_line = TRUE, logrank = TRUE,
x_lab = "Months", title = "Overall survival")
# survminer-style figure: risk table, median guides and a log-rank test
data(clinical_trial)
survival_plot(clinical_trial$time, clinical_trial$event,
group = clinical_trial$arm, risk_table = TRUE,
median_line = TRUE, logrank = TRUE,
x_lab = "Months", title = "Overall survival")