
Show a finished figure as a reader with a colour-vision deficiency sees it
Source:R/colours.R
simulate_figure.Rdsimulate_cvd() simulates a set of colours, and this function the figure
they end up in, legend, colourbar, text and background included.
Arguments
- plot
A ggplot or a patchwork, as it would be saved.
- deficiency
The deficiency to simulate:
"protan"or"deutan"(the two red-green forms) or"tritan"(blue-yellow).- severity
Severity in
[0, 1]. Zero leaves the colours unchanged and one is the full deficiency. Machado et al. publish a matrix for each tenth of severity, which is used as it stands at 0.1, 0.2 and so on. A severity between two tenths takes the linear interpolation of their matrices, as the authors suggest and as the colorspace package does.
Value
A gtable, which grid::grid.draw() draws and save_plot() saves.
Details
The plot is turned into the table of grobs that would be drawn, with
ggplot2::ggplotGrob() or, for a patchwork, patchwork::patchworkGrob().
Every colour in that table then goes through simulate_cvd(). That covers
the line and fill colours of each grob, at any depth, and each cell of a
raster, such as a colourbar, a ggplot2::geom_raster() layer or an image
added with ggplot2::annotation_raster(). Each colour keeps its alpha
channel. Missing and transparent colours are left as they are, and so are
gradient and pattern fills such as grid::linearGradient(), which keep
their original colours.
The colours are changed after the plot is built. Changing the colours of the data before it is built would leave the legend keys and any colourbar in their original colours, so the legend would no longer match the figure.
The figure stays vector graphics, so it can be saved at any size. The Python
twin's simulate_figure() uses the same matrices but rasterises the figure
and simulates its pixels, so it returns an image.
References
Machado GM, Oliveira MM, Fernandes LAF (2009). “A physiologically-based model for simulation of color vision deficiency.” IEEE Transactions on Visualization and Computer Graphics, 15(6), 1291–1298. doi:10.1109/TVCG.2009.113 .
See also
check_figure(), which measures what this shows.
Examples
library(ggplot2)
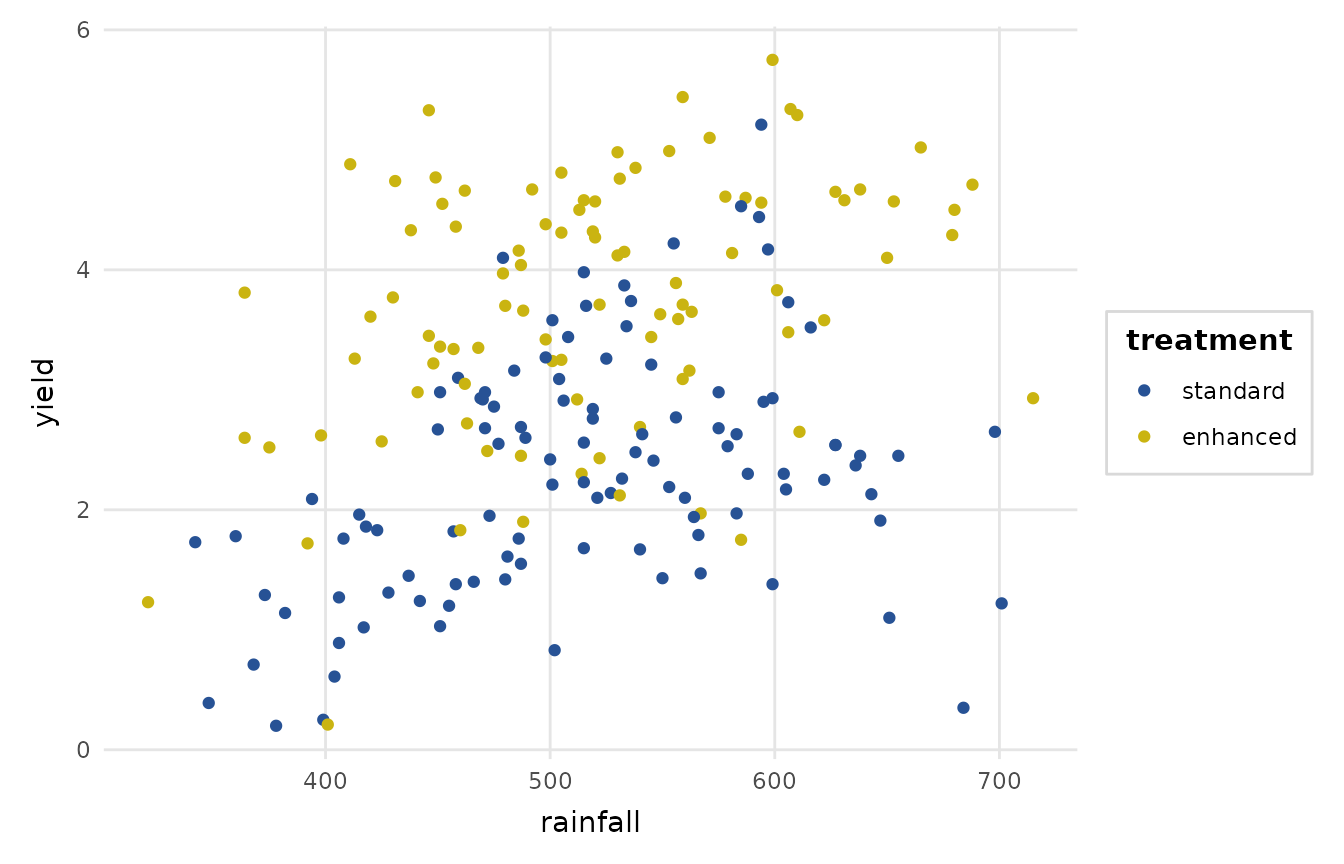
p <- ggplot(crop_yield, aes(rainfall, yield, colour = treatment)) +
geom_point() +
scale_colour_depictr() +
theme_depictr()
# The figure as a reader with deuteranopia sees it.
seen <- simulate_figure(p, "deutan")
grid::grid.newpage()
grid::grid.draw(seen)
 # Saved for a side-by-side comparison with the original.
save_plot(file.path(tempdir(), "yield-deutan.png"), seen)