Discrete ggplot2 scales using depictr_palette(). These are the canonical
colour and fill scales used throughout the package. They honour the global
options(depictr.palette = ) (via depictr_palette()) and
options(depictr.na_value = ) settings; see depictr_options().
Usage
scale_colour_depictr(
  n = NULL,
  palette = NULL,
  na.value = depictr_opt("na_value"),
  order = c("default", "contrast"),
  ...
)

scale_color_depictr(
  n = NULL,
  palette = NULL,
  na.value = depictr_opt("na_value"),
  order = c("default", "contrast"),
  ...
)

scale_fill_depictr(
  n = NULL,
  palette = NULL,
  na.value = depictr_opt("na_value"),
  order = c("default", "contrast"),
  ...
)
Arguments
- n
Optional number of colours to draw from
depictr_palette(). By default ggplot2 requests exactly as many colours as there are groups; passnonly to force a fixed slice of the palette. More than eight groups means the built-in qualitative palette is interpolated, which loses the colour-vision-deficiency guarantee and warns at draw time; facet the groups or use a sequential scale when there are that many.- palette
Optional palette override: a function of one argument (the number of colours) returning a character vector of colours. Defaults to
depictr_palette().- na.value
Colour for
NAlevels. Defaults to the resolveddepictr.na_valueoption (the muted grey"grey80"unless changed).- order
"default", or"contrast"to draw the groups in the contrast-first order ofdepictr_palette(), with which two or three groups pass every colour row ofcheck_figure(). More than four groups warn at draw time. It cannot be combined withpalette.- ...
Passed to
ggplot2::discrete_scale().
Examples
library(ggplot2)
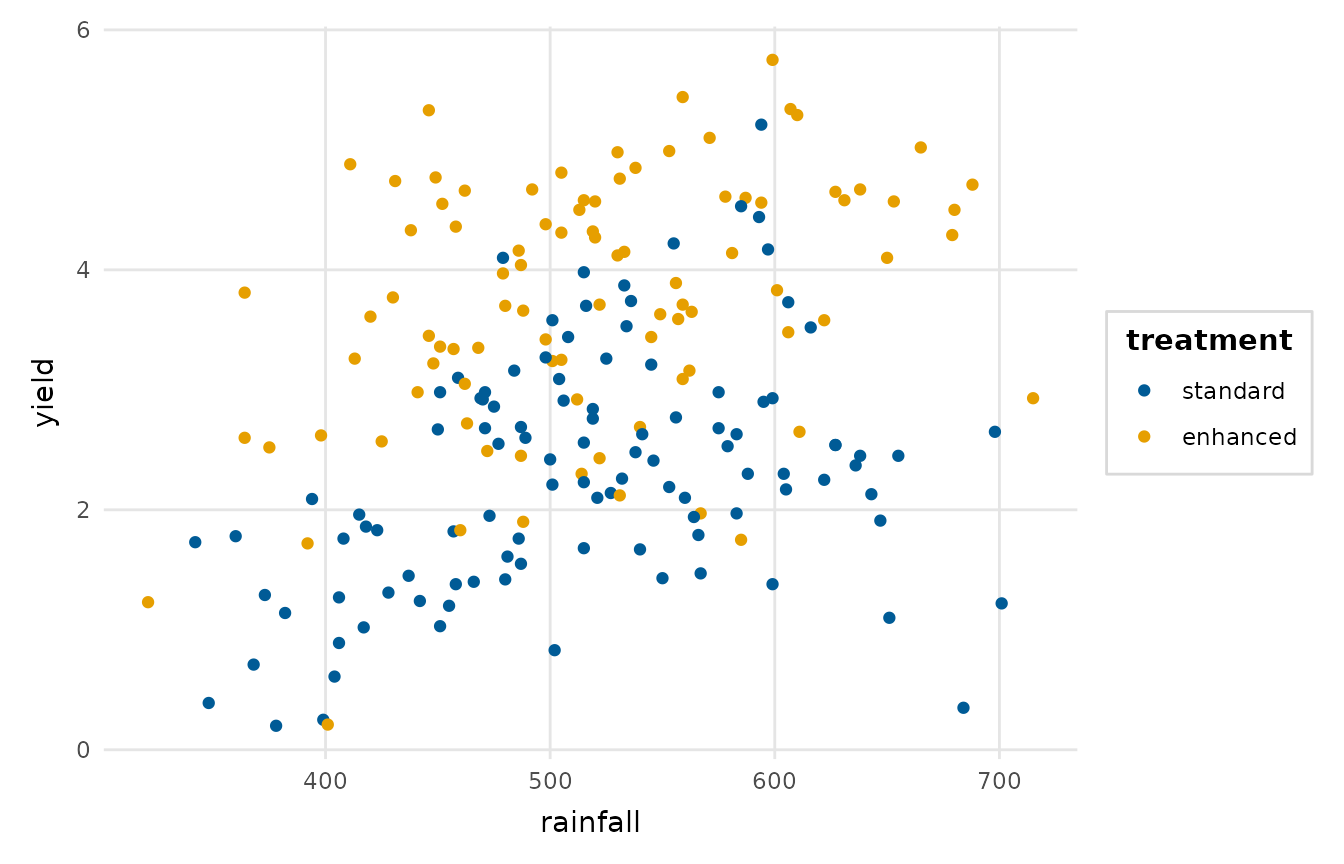
ggplot(crop_yield, aes(rainfall, yield, colour = treatment)) +
geom_point() +
scale_colour_depictr() +
theme_depictr()
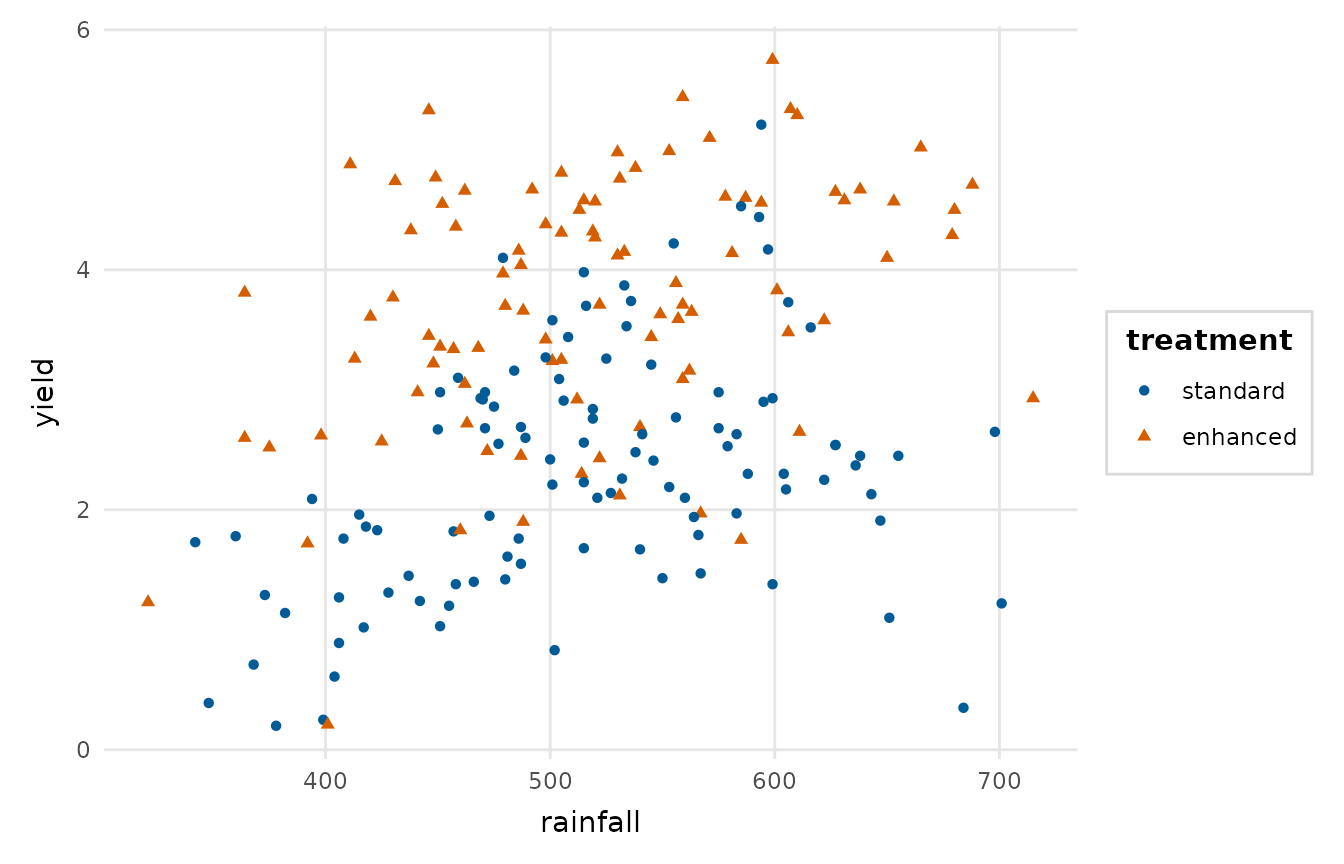
 # The vermillion in the orange's place, at 3.87:1 against white
ggplot(crop_yield, aes(rainfall, yield, colour = treatment,
shape = treatment)) +
geom_point() +
scale_colour_depictr(order = "contrast") +
theme_depictr()
# The vermillion in the orange's place, at 3.87:1 against white
ggplot(crop_yield, aes(rainfall, yield, colour = treatment,
shape = treatment)) +
geom_point() +
scale_colour_depictr(order = "contrast") +
theme_depictr()