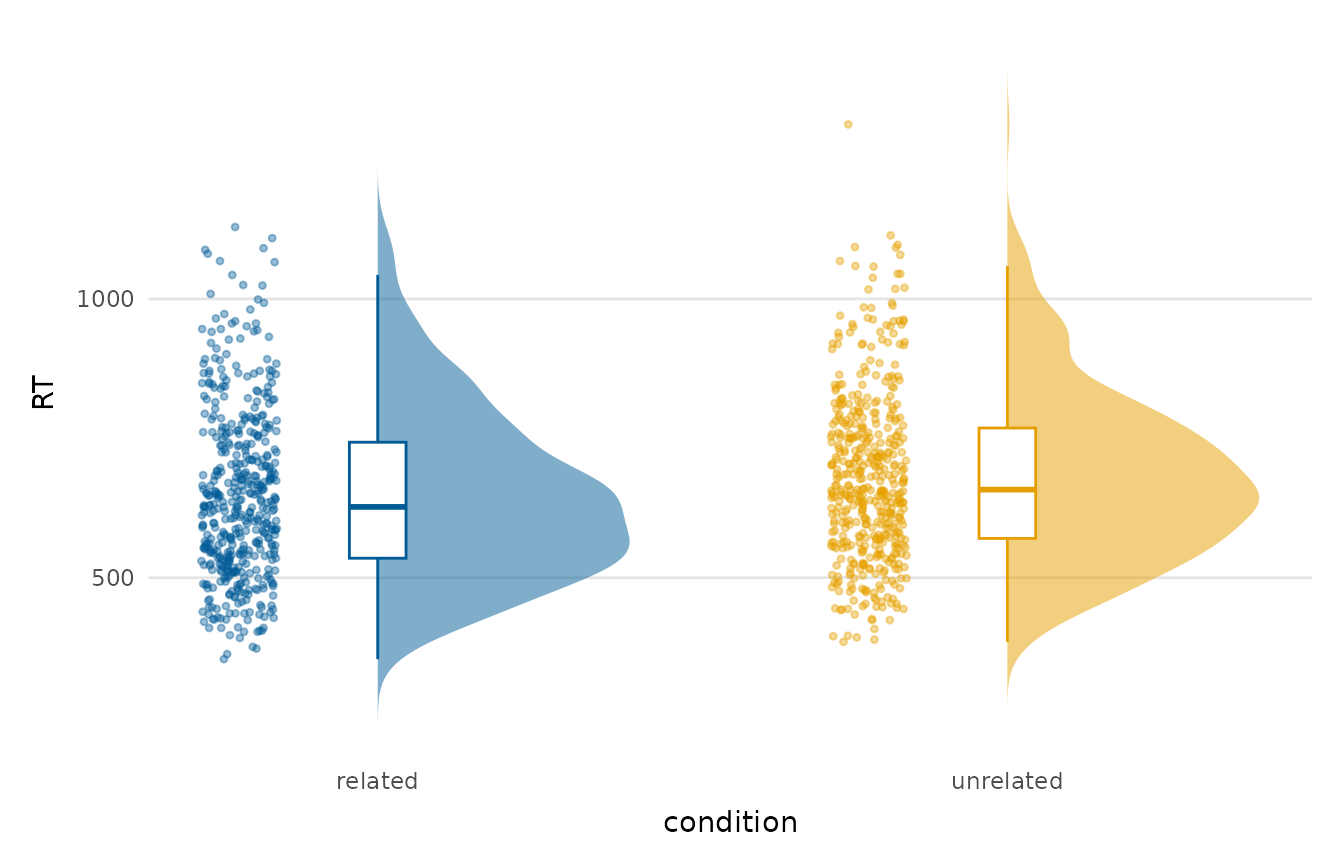
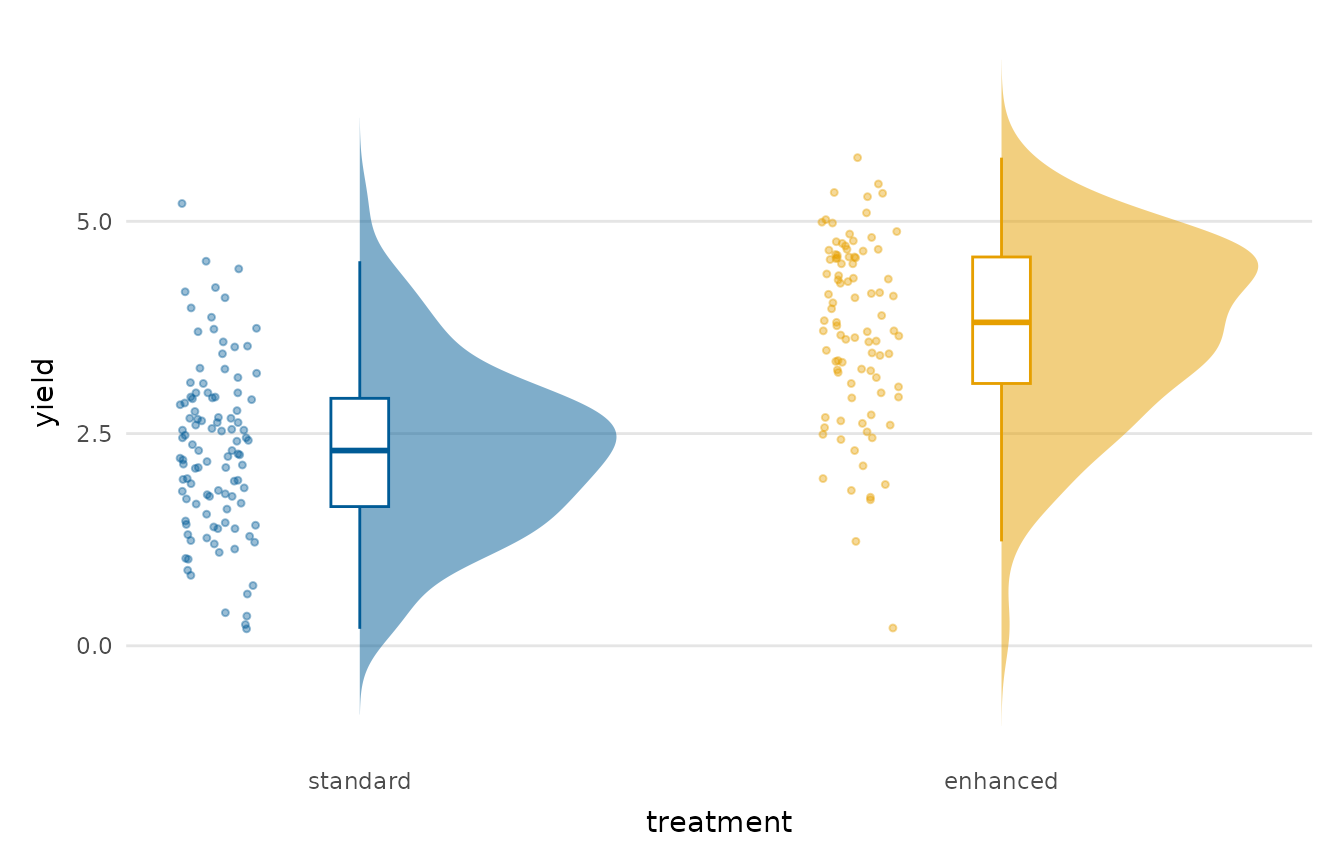
A "raincloud" combines three views of a distribution: a half-violin density (the cloud), a narrow boxplot, and the raw jittered points (the rain). It conveys the shape, the summary and the individual observations together, giving a fuller and more transparent picture than a boxplot alone. The plot is built with base R and ggplot2 alone, with no extra package dependency.
Usage
raincloud_plot(
  data,
  y,
  group = NULL,
  width = 0.4,
  point_alpha = 0.4,
  palette = NULL,
  title = NULL,
  x_lab = NULL,
  y_lab = NULL
)
Arguments
- data
A data frame.
- y
The numeric variable (string or unquoted name).
- group
Optional grouping variable on the x-axis. A numeric code counts as a group, but a numeric column with more than 20 distinct values is refused as continuous. Rows with a missing group are dropped with a message, and levels without rows are left out of the plot and its palette.
- width
Maximum width of the half-violin.
- point_alpha
Transparency of the rain points.
- palette
Colours for the groups; defaults to
depictr_palette().- title, x_lab, y_lab
Title and axis labels.
Value
A ggplot2::ggplot object.