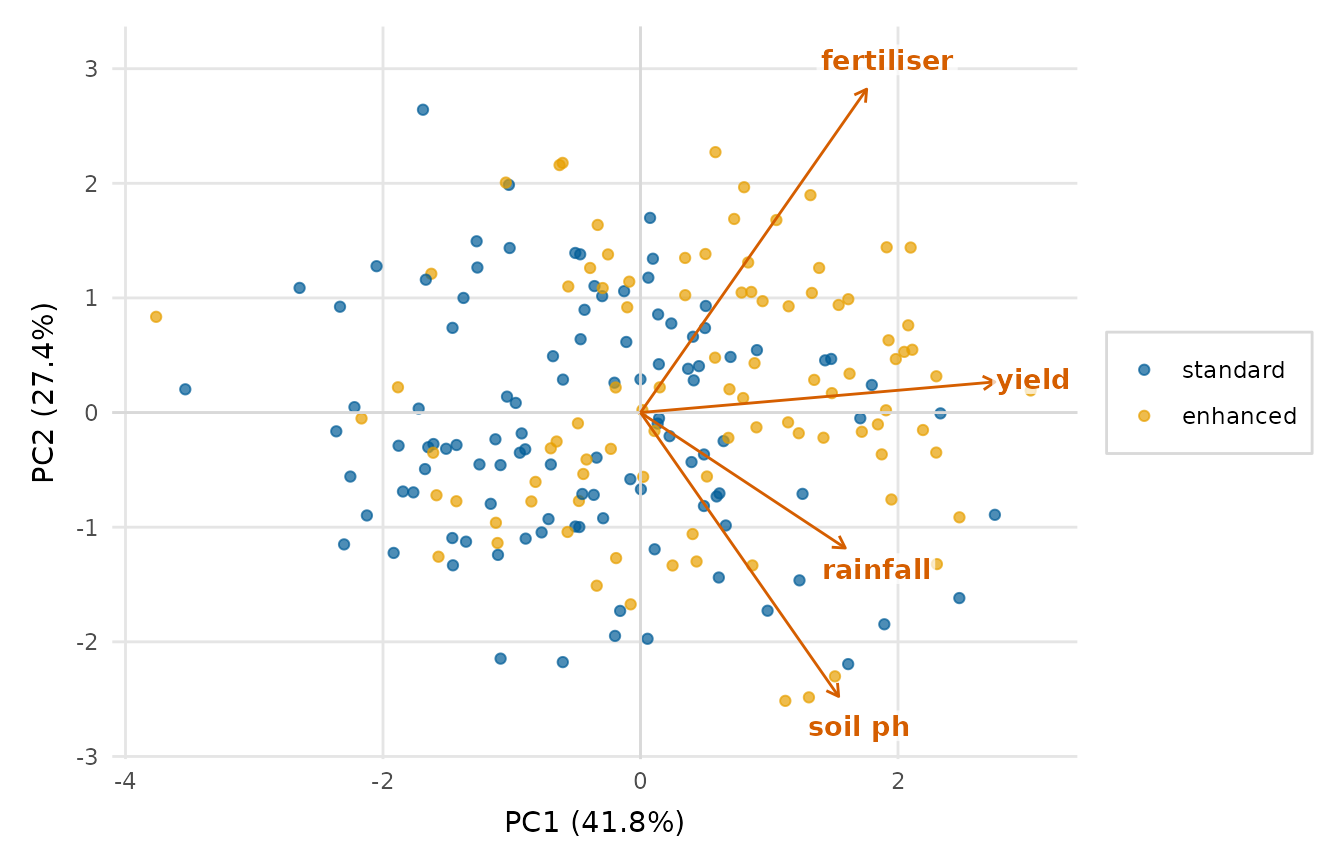
Runs a principal component analysis on the numeric columns of a data frame
(or takes an existing stats::prcomp() object) and draws a biplot: the
observations projected onto two components, with the variable loadings shown
as arrows. Optionally colour the observations by a grouping variable.
Usage
pca_plot(
  x,
  cols = NULL,
  group = NULL,
  components = c(1, 2),
  scale = TRUE,
  loadings = TRUE,
  point_alpha = 0.7,
  palette = NULL,
  title = NULL
)
Arguments
- x
A data frame, or a
stats::prcomp()object.- cols
When
xis a data frame, the numeric columns to analyse (default: all numeric).- group
Optional grouping variable mapped to colour. When
xis a data frame, give a column ofx, unquoted or as a string, or a vector with one value per row ofx. Rows with missing values count, although the analysis drops them. Whenxis astats::prcomp()object, give a vector with one value per observation. A name that matches no column, or a vector of another length, is an error.- components
Length-2 integer vector: which components to plot.
- scale
Whether to scale the variables to unit variance before the PCA. This is advisable when the variables are on different scales.
- loadings
Whether to draw variable-loading arrows.
- point_alpha
Point transparency.
- palette
Colours for the groups; defaults to
depictr_palette().- title
Plot title.
Value
A ggplot2::ggplot object.
Details
Each arrow is a variable's loadings on the two components, taken from the
rotation matrix and multiplied by a factor that all the arrows share. The
factor makes the largest coordinate of any arrow three quarters of the
largest absolute score. Both axes use that one factor, as stats::biplot() uses one
ratio for both, and the aspect ratio is fixed at 1. An arrow's angle on the
page is therefore its angle in loading space, whatever the size of the
figure. The panel's height and width follow the ranges of its two axes, so a
figure of another shape leaves blank space around the panel. Because the
scores are drawn as they are and the arrows as loadings, the angle between
two arrows does not estimate the correlation between their variables. Arrows
and labels are drawn in a neutral dark grey (grey20), which is not in the
default palette, so no arrow reads as part of a group.
Examples
pca_plot(crop_yield, cols = c("rainfall", "fertiliser", "soil_ph", "yield"),
         group = "treatment")