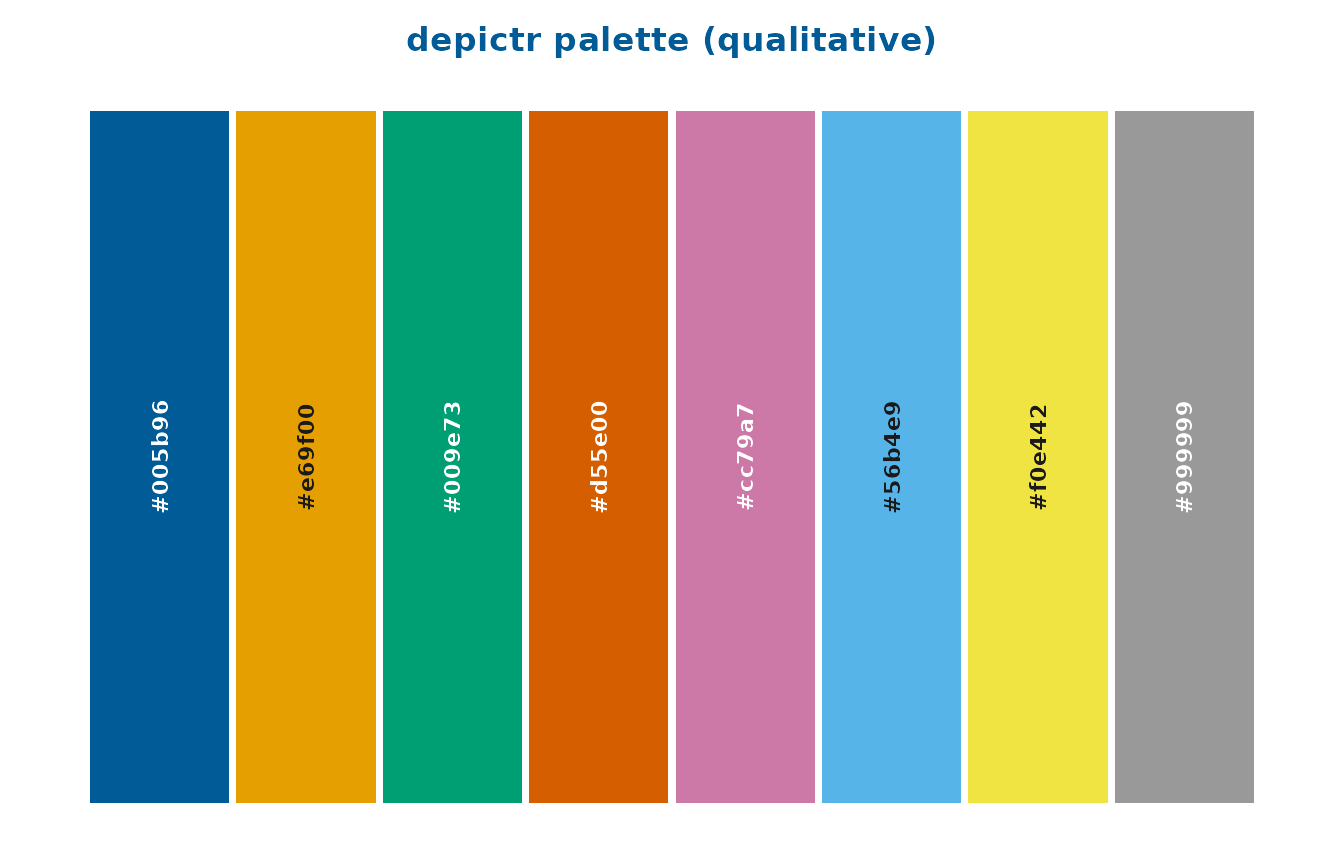
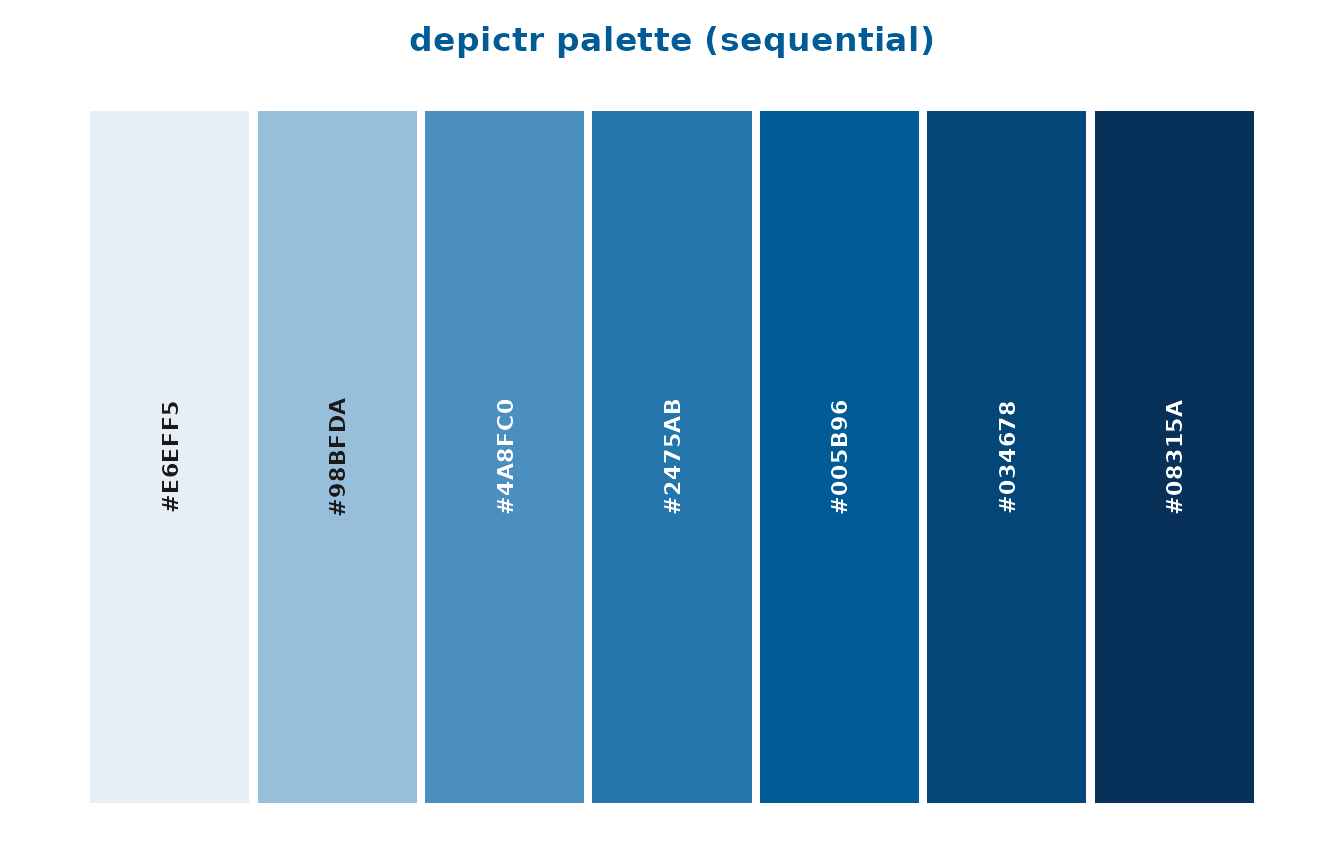
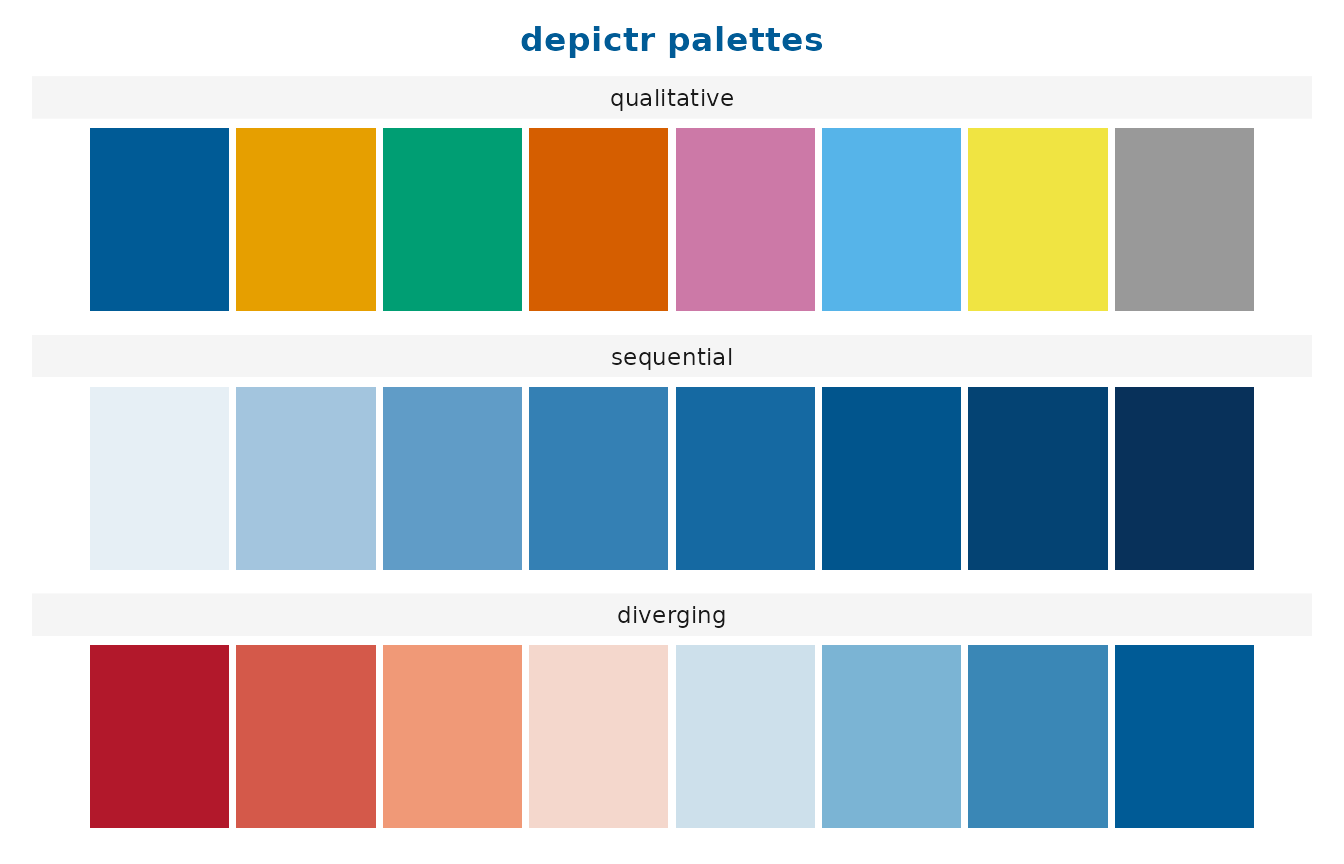
Displays the colours returned by depictr_palette() as labelled swatches.
It is useful when choosing how many groups to show, selecting a palette type,
or documenting a figure. Each swatch's hex label is drawn in black or white,
whichever has the higher WCAG contrast against that tile, so every label
reaches the 4.5:1 that WCAG 2.2 asks of text.
Arguments
- n
Number of colours to preview.
- type
Palette type to preview:
"qualitative","sequential","diverging", or"all"to show all three.- cvd
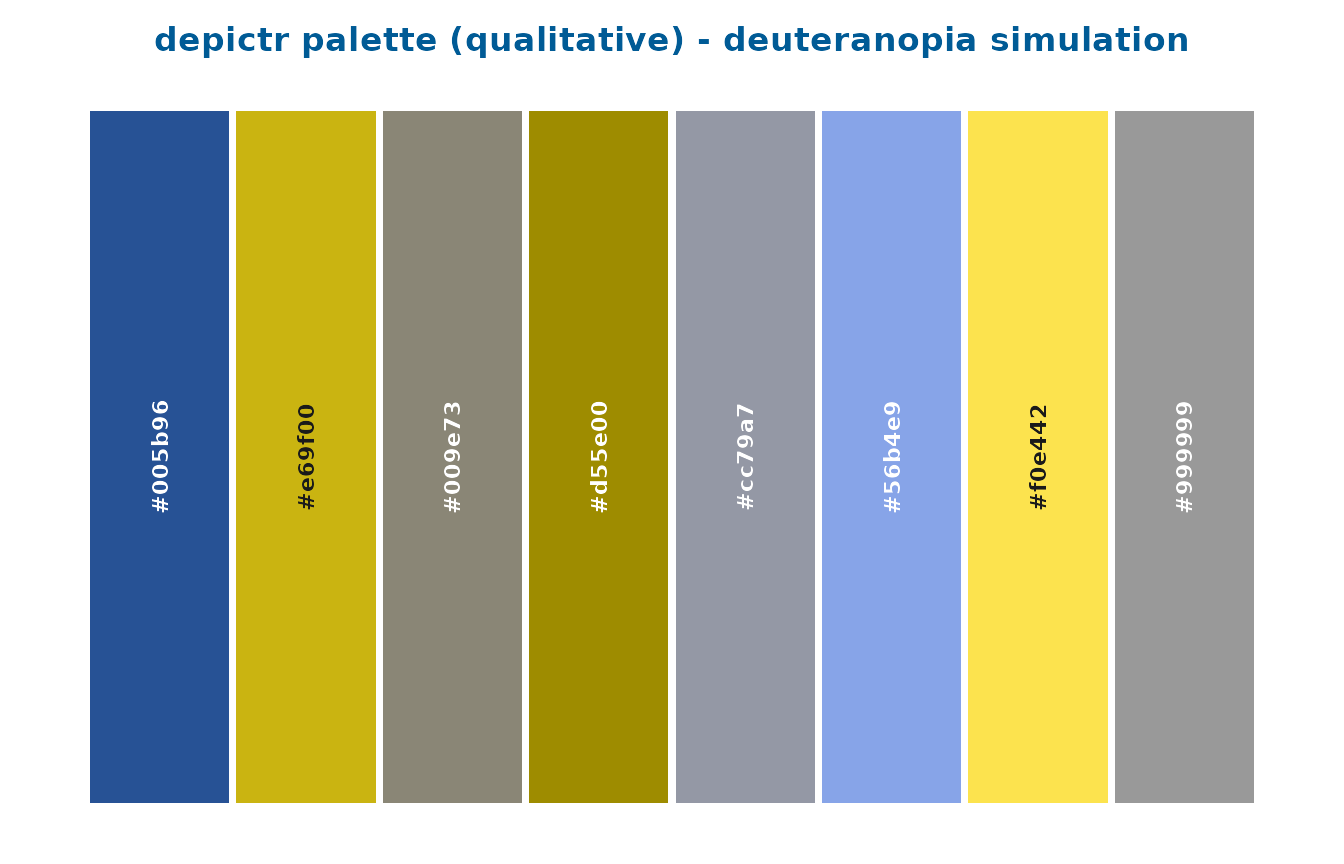
Colour-vision-deficiency simulation for the tiles:
"none"(the default, true colours),"deutan"(red-green, deuteranopia),"protan"(red-green, protanopia) or"tritan"(blue-yellow, tritanopia).
Value
A ggplot2::ggplot object.
Details
Set cvd to render the swatches as they would appear under a colour-vision
deficiency, using the Machado et al. (2009) simulation. The tiles are
recoloured to the simulated appearance while the labels keep the original
hex code, so you can see whether two groups would still be told apart by a
colourblind reader.
References
Machado GM, Oliveira MM, Fernandes LAF (2009). “A physiologically-based model for simulation of color vision deficiency.” IEEE Transactions on Visualization and Computer Graphics, 15(6), 1291–1298. doi:10.1109/TVCG.2009.113 .