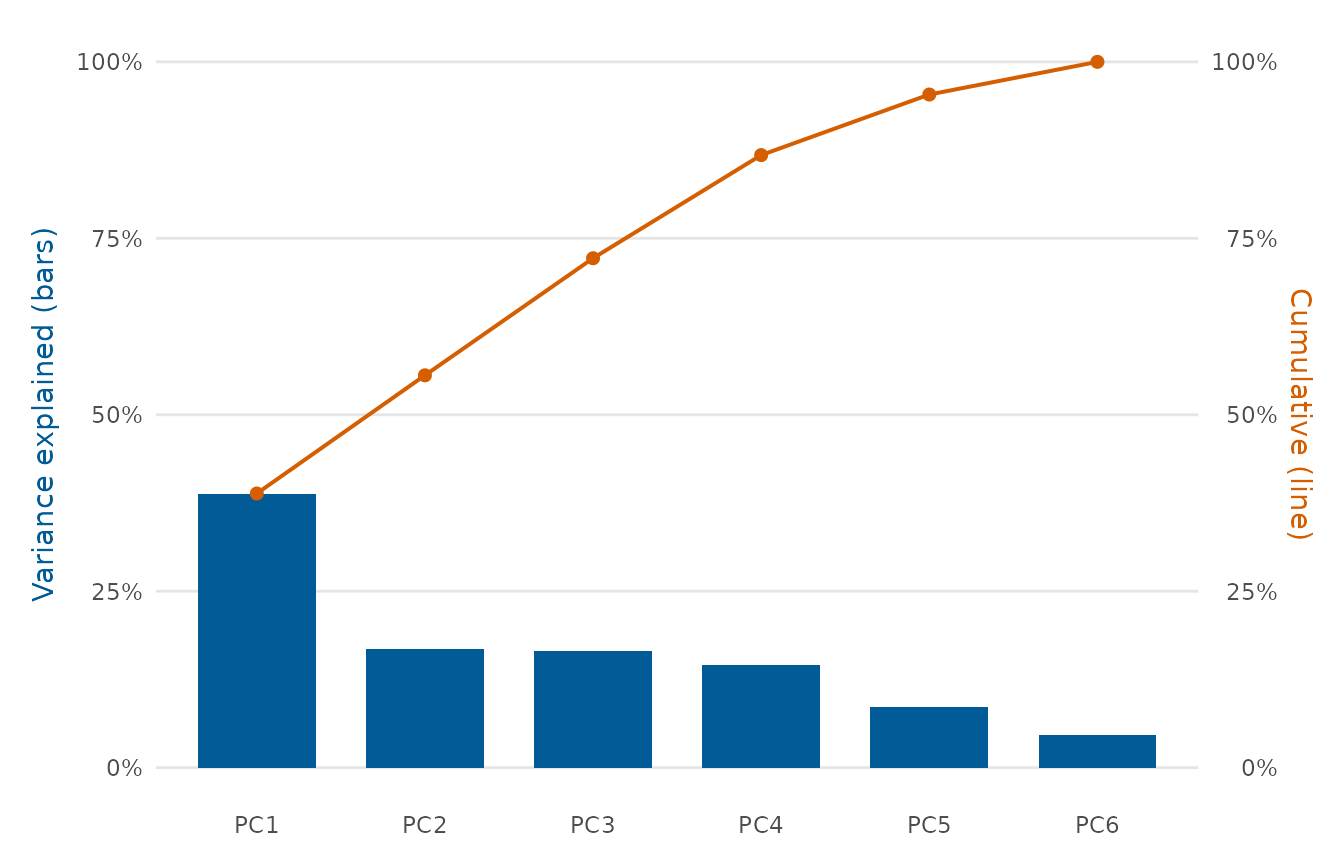
Shows the proportion of variance explained by each principal component, as bars with a cumulative line. It is the customary aid for deciding how many components to retain.
Arguments
- x
A data frame, or a
stats::prcomp()object.- cols
When
xis a data frame, the numeric columns to analyse.- scale
Whether to scale variables to unit variance before the PCA.
- n
Maximum number of components to display.
- title
Plot title.
Value
A ggplot2::ggplot object.
Examples
scree_plot(wellbeing_survey,
           cols = c("age", "income", "stress", "sleep_hours",
                    "exercise_days", "life_satisfaction"))