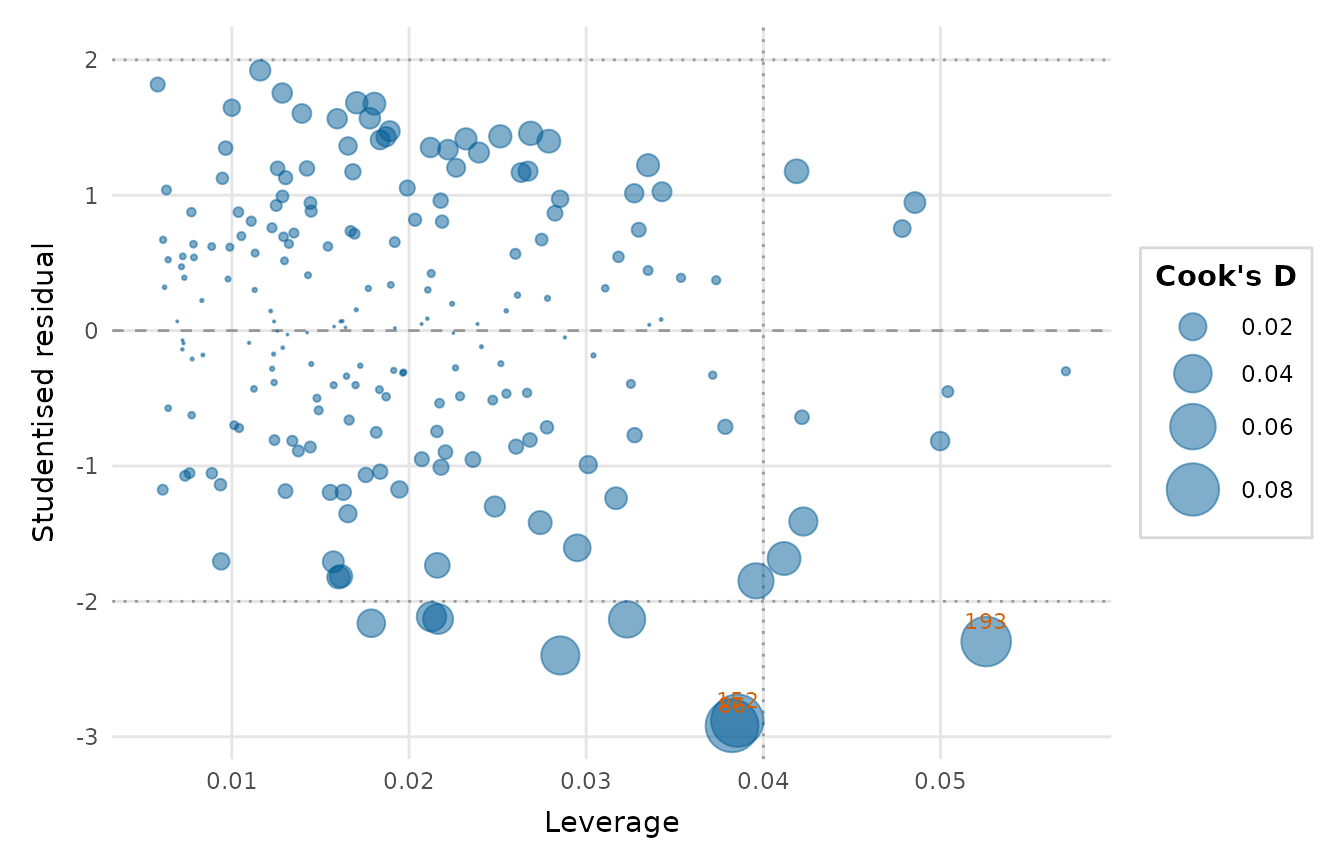
A bubble plot of leverage against the studentised residuals, with bubble area proportional to Cook's distance. It summarises in a single picture which observations most influence a fitted model. Reference lines mark large residuals and high-leverage points, and the most influential observations are labelled.
Value
A ggplot2::ggplot object.
References
Cook RD (1977). “Detection of influential observation in linear regression.” Technometrics, 19(1), 15–18. doi:10.1080/00401706.1977.10489493 .
Examples
fit <- lm(yield ~ rainfall + fertiliser + soil_ph, data = crop_yield)
influence_plot(fit)