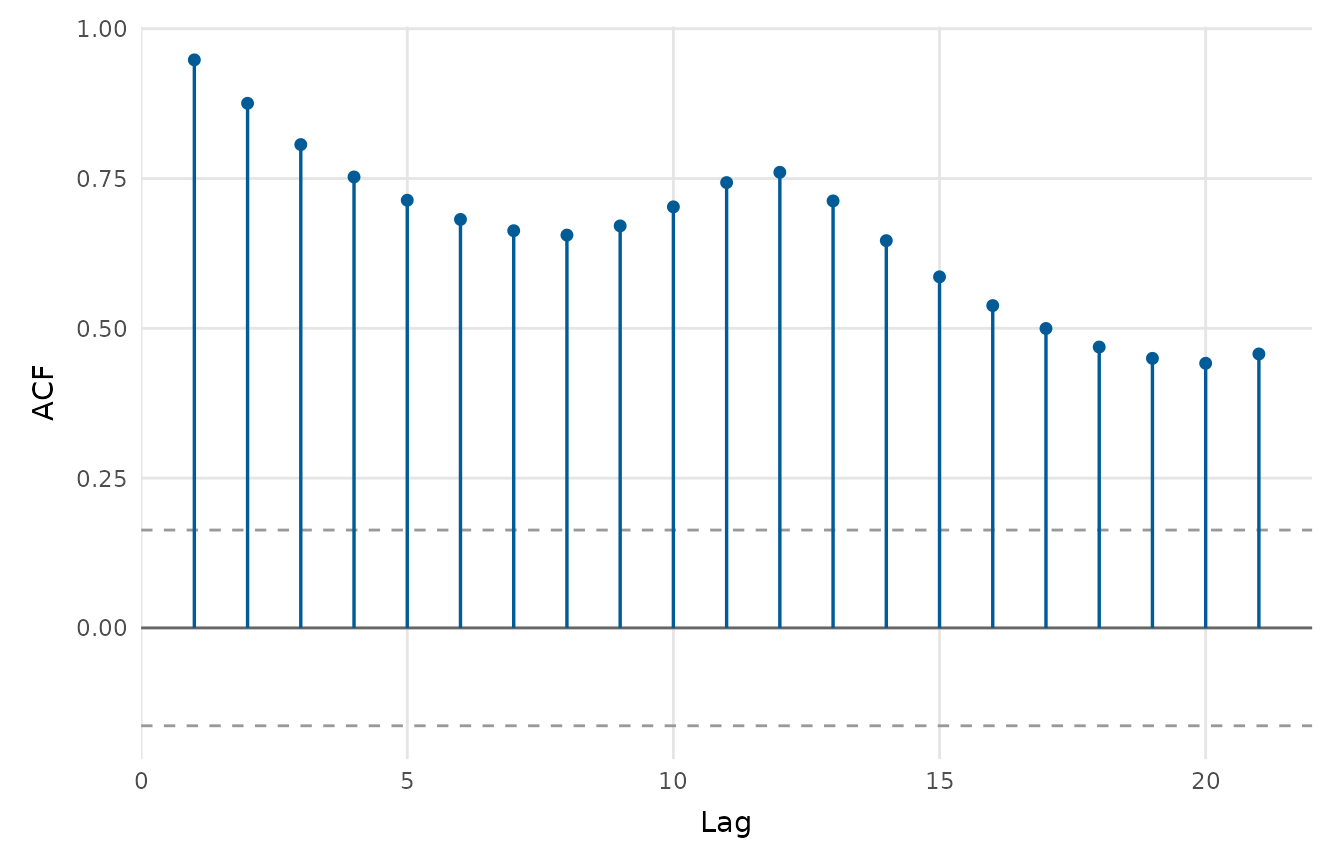
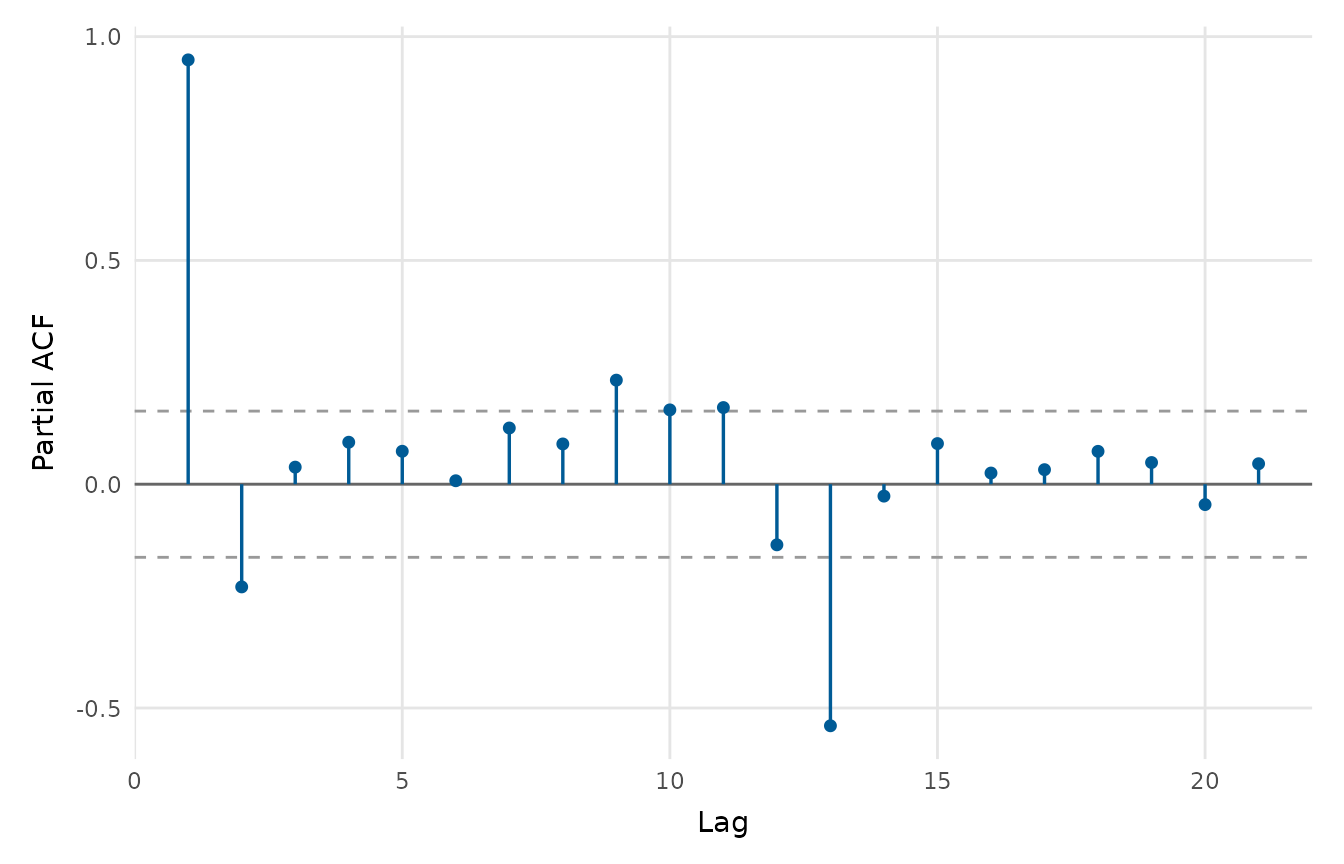
Plots the autocorrelation (or partial autocorrelation) function of a series, with the approximate significance bounds, as a clean lollipop chart.
Usage
acf_plot(
  x,
  lag_max = NULL,
  type = c("correlation", "partial"),
  conf_level = 0.95,
  title = NULL,
  x_lab = "Lag",
  y_lab = NULL
)
Arguments
- x
A numeric vector or
tsobject holding one series. A multivariatetsor a matrix with several columns is refused.- lag_max
Maximum lag (passed to
stats::acf()/stats::pacf()).- type
"correlation"for the ACF or"partial"for the PACF.- conf_level
Confidence level for the significance bounds; a single number strictly between 0 and 1.
- title, x_lab, y_lab
Title and axis labels.
Value
A ggplot2::ggplot object.
Details
A missing value inside the series is kept in its place, and the
correlations are computed from the pairs of observations that are both
present (na.action = na.pass), with a warning. Dropping it would join the
observations on either side of the gap as if they were neighbours. The
Python package refuses such a series and asks for the gap to be dropped or
imputed first.