Note
Go to the end to download the full example code.
Multivariate and time series#
Principal components and clustering (via scikit-learn), and a seasonal decomposition (via statsmodels), all redrawn in the depictr theme.
import numpy as np
import pandas as pd

import depictr as dp

wb = dp.wellbeing_survey()
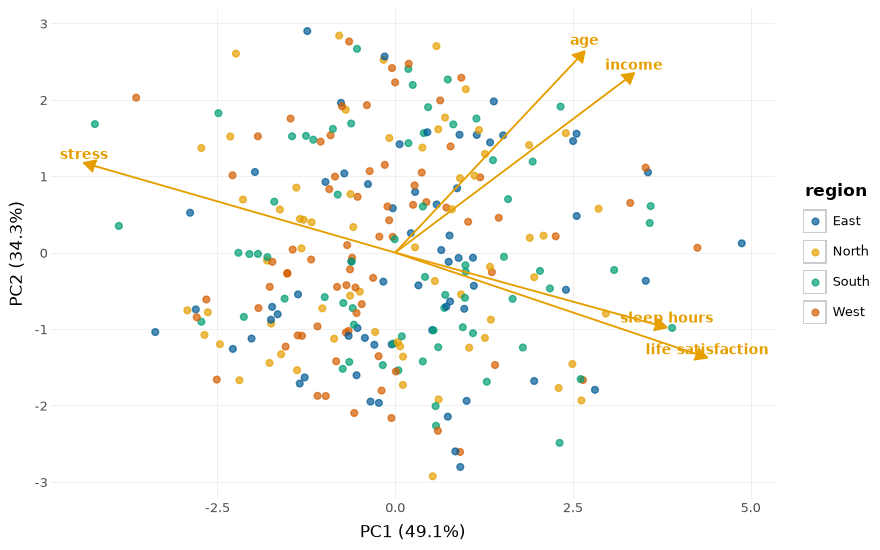
A PCA biplot, coloured by group, with the variable loadings.
p = dp.pca_plot(wb, group="region")
p
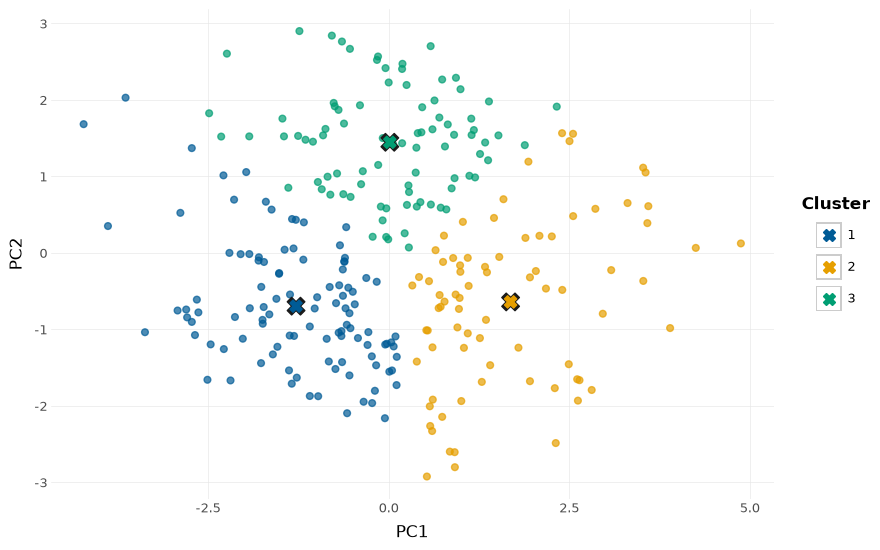
k-means clusters on the first two principal components.
p = dp.cluster_plot(wb, k=3)
p
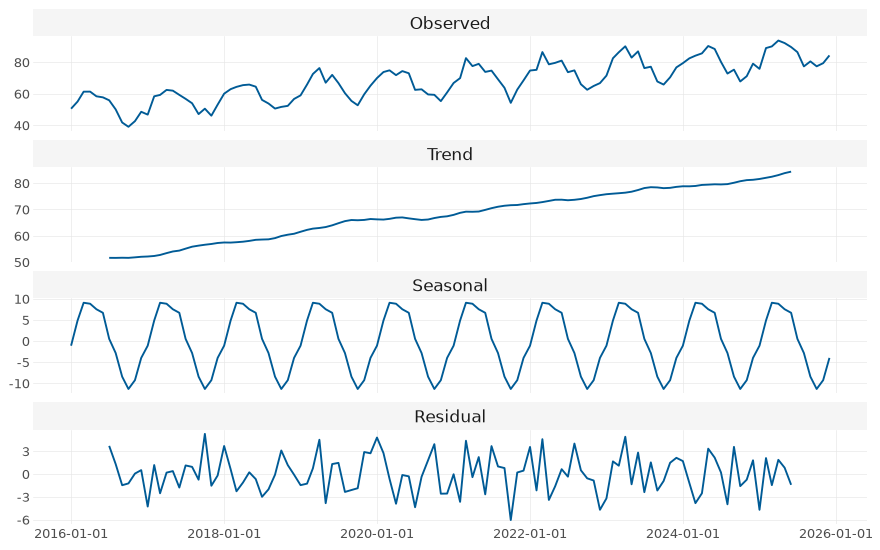
A monthly series with a trend, a 12-period season and noise.
rng = np.random.default_rng(0)
t = np.arange(120)
series = pd.Series(
    50 + 0.3 * t + 10 * np.sin(2 * np.pi * t / 12) + rng.normal(0, 3, 120),
    index=pd.period_range("2016-01", periods=120, freq="M"),
)
Its seasonal decomposition (observed, trend, seasonal, residual).
p = dp.decompose_plot(series, period=12)
p
Total running time of the script: (0 minutes 0.823 seconds)