Note
Go to the end to download the full example code.
Exploratory analysis#
A first look at a dataset, all in one theme: distributions, categories, correlations, cumulative distributions and a missing-data map.
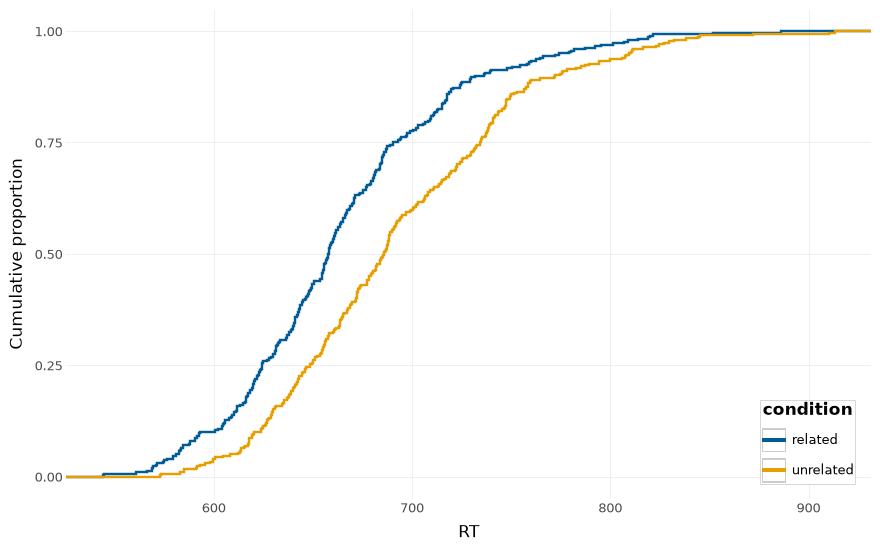
Empirical cumulative distribution by group, with the legend tucked into the bottom-right the curves leave empty once they saturate.
p = dp.ecdf_plot(ld, "RT", group="condition", legend_inside=True)
p
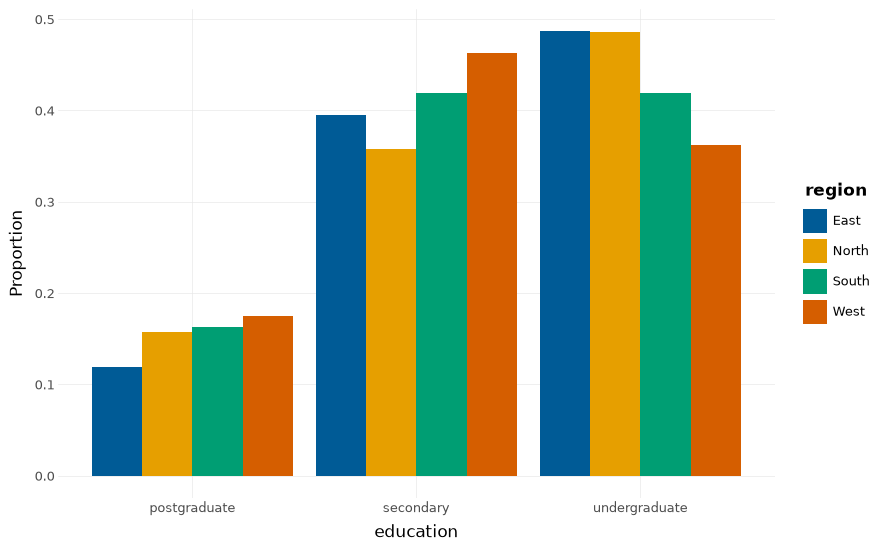
A dodged categorical comparison.
p = dp.explore_categorical(wb, "education", group="region")
p
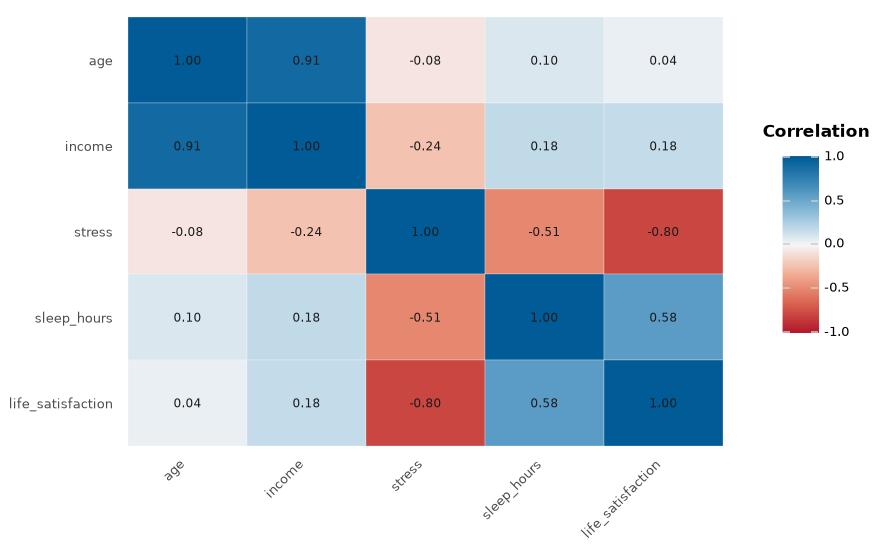
A correlation heatmap of the numeric columns.
p = dp.correlation_heatmap(wb)
p
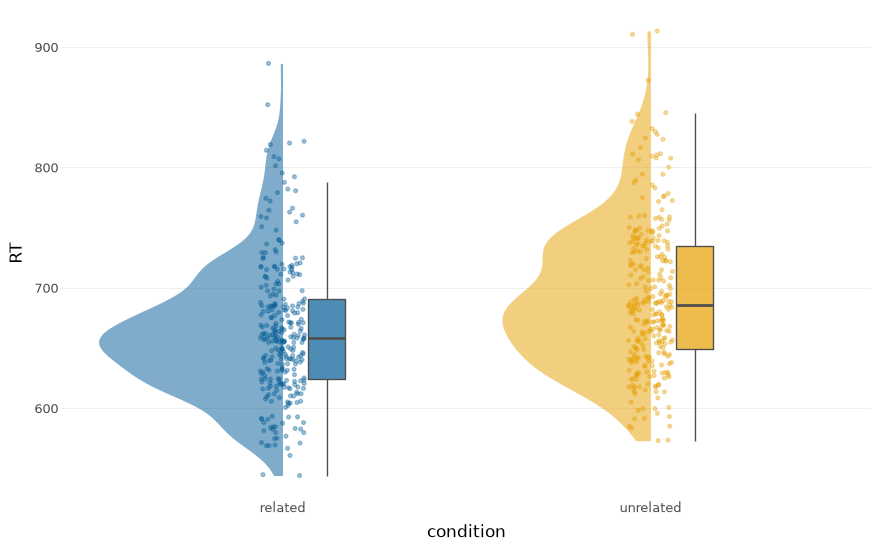
A raincloud: density, box and raw points together.
p = dp.raincloud_plot(ld, "RT", group="condition")
p
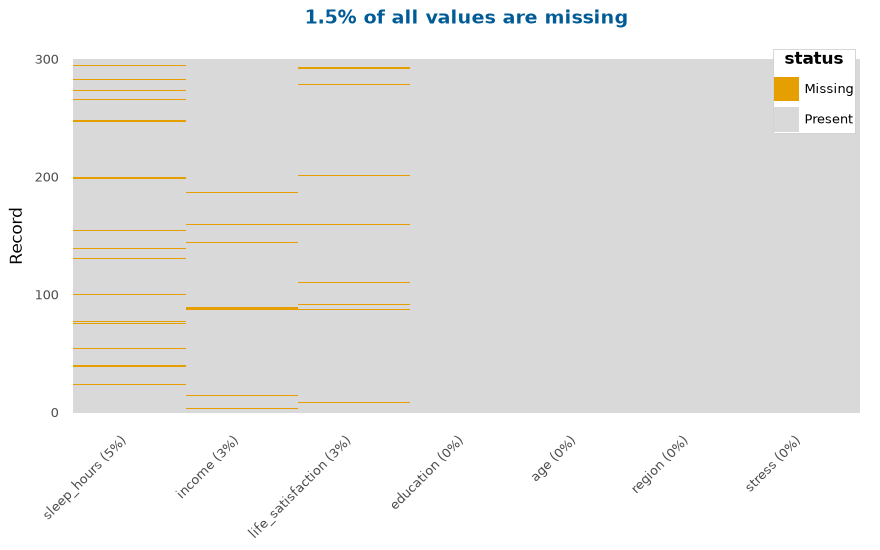
A missing-data map; columns are ordered most- to least-missing, so the legend sits inside the top-right over the most-complete columns.
p = dp.missingness_map(wb, legend_inside=True)
p
Total running time of the script: (0 minutes 0.931 seconds)