Note
Go to the end to download the full example code.
Model estimates and diagnostics#
Fit a model once, then read it from several angles: a coefficient forest, the predicted effect of a predictor, an estimation plot of group differences, and a panel of regression diagnostics.
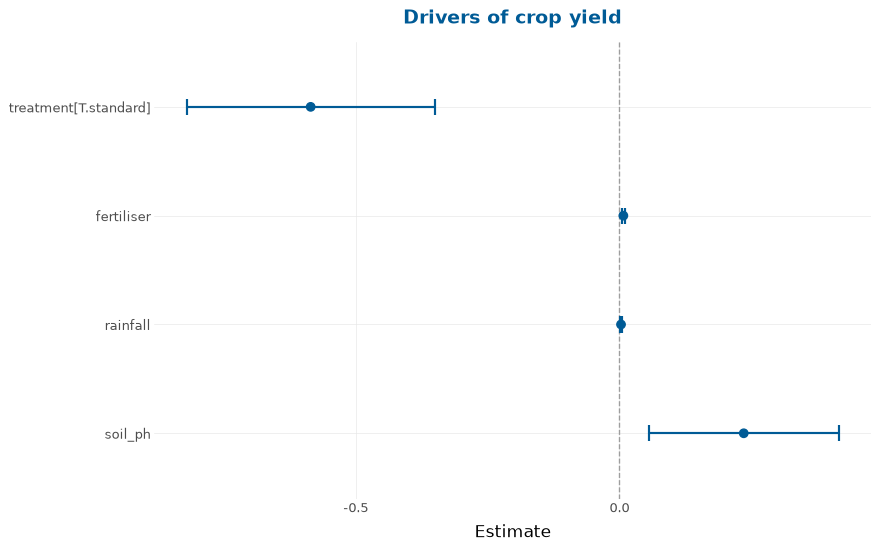
A dot-and-whisker forest of the coefficients.
p = dp.coefficient_plot(model, title="Drivers of crop yield")
p
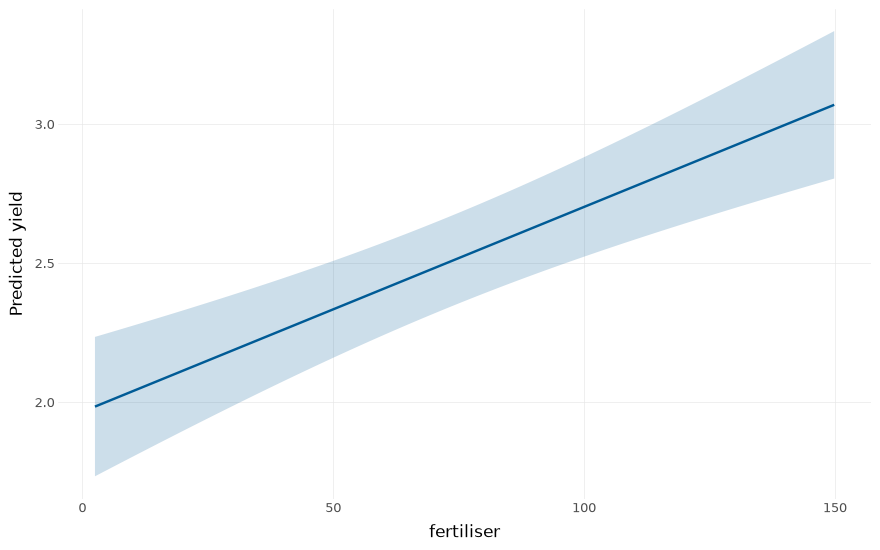
The predicted response as one predictor varies, with a confidence band.
p = dp.effects_plot(model, "fertiliser")
p
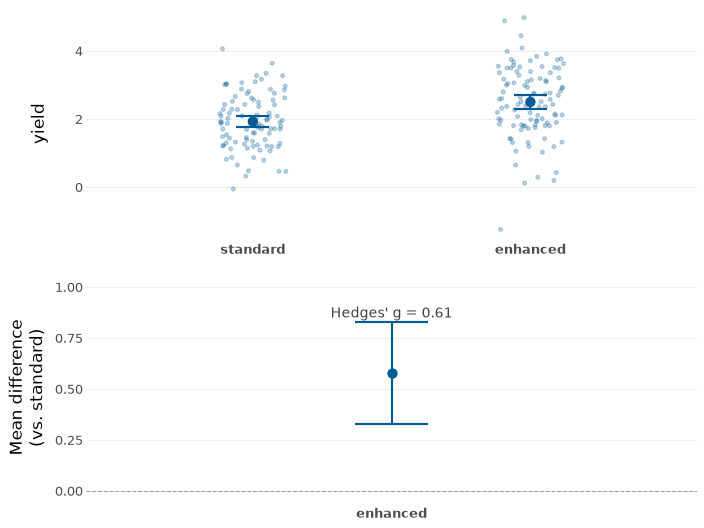
A two-panel Gardner-Altman estimation plot of the group difference.
p = dp.estimation_plot(cy, "yield", "treatment", two_panel=True, seed=1)
p
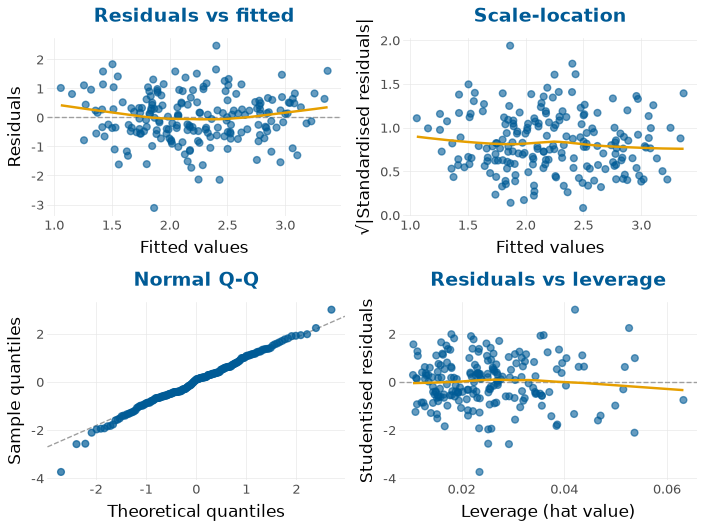
The four-panel residual-diagnostic dashboard.
p = dp.residual_diagnostics_plot(model)
p
Total running time of the script: (0 minutes 1.080 seconds)