Plotting two-way interactions from mixed-effects models using ten or six bins
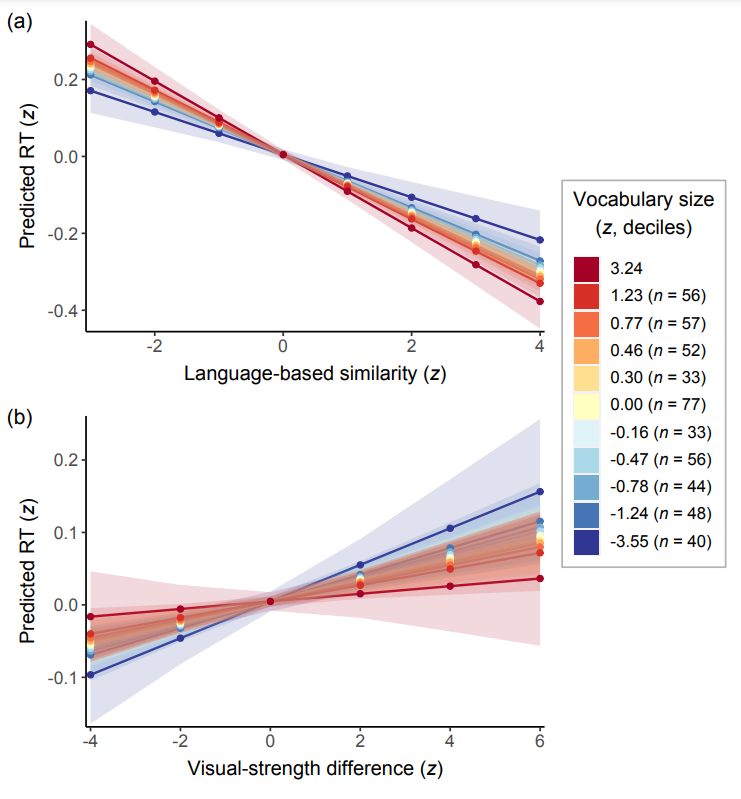
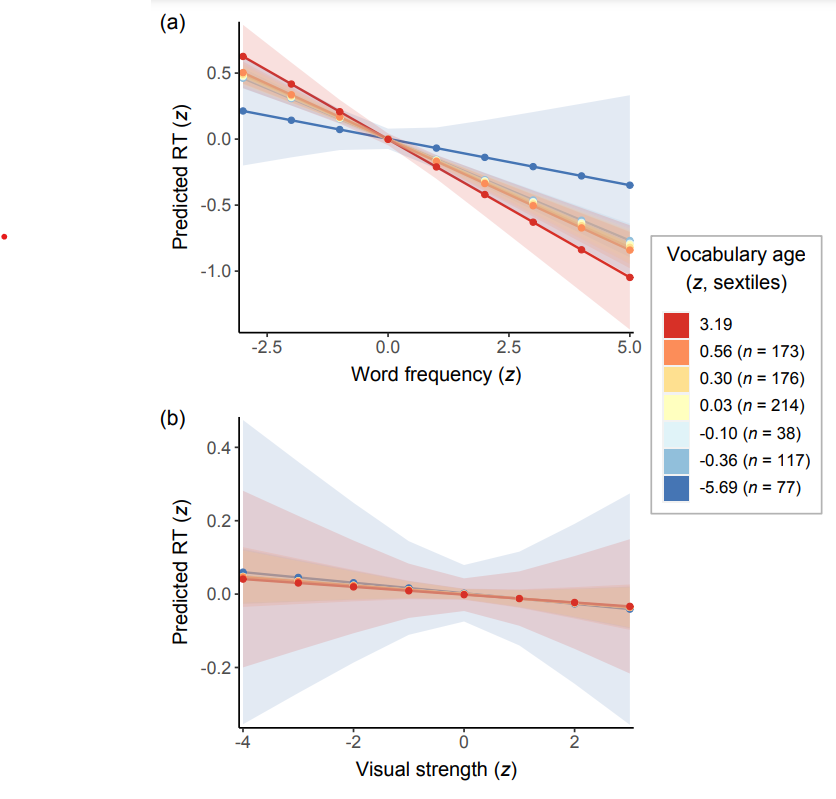
Whereas the direction of main effects can be interpreted from the sign of the estimate, the interpretation of interaction effects often requires plots. This task is facilitated by the R package sjPlot (Lüdecke, 2022). In Bernabeu (2022), the sjPlot function called plot_model served as the basis for the creation of some custom functions. Two of these functions are deciles_interaction_plot and sextiles_interaction_plot. These functions allow the plotting of interactions between two continuous variables. In the case of deciles_interaction_plot, one of the variables is divided into ten bins, known as deciles, and the other variable is unchanged. In the case of sextiles_interaction_plot, one of the variables is divided into six bins, or sextiles, and the other variable is unchanged. Sample size per bin can be printed in the legend, which is particularly useful for research involving individual differences.
Below, we’ll use these functions with models fitted using lmerTest (Kuznetsova et al., 2022), although the functions also work with several other models (see sjPlot manual). The plots can be reproduced using the materials at https://osf.io/gt5uf.
Deciles interaction plot
The function
The function in use
Sextiles interaction plot
The function
The function in use
References
Bernabeu, P. (2022). Language and sensorimotor simulation in conceptual processing: Multilevel analysis and statistical power. Lancaster University. https://doi.org/10.17635/lancaster/thesis/1795
Kuznetsova, A., Brockhoff, P. B., & Christensen, R. H. B. (2022). Package ‘lmerTest’. CRAN. https://cran.r-project.org/web/packages/lmerTest/lmerTest.pdf
Lüdecke, D. (2022). Package ‘sjPlot’. CRAN. https://cran.r-project.org/web/packages/sjPlot/sjPlot.pdf