depictr: A unified toolkit for visualising statistical models and data
SoftwareAbstract
Twin R and Python packages for producing consistent, publication-ready statistical graphics from exploratory analysis through model estimates, diagnostics, uncertainty and power. The toolkit includes colourblind-aware palettes and measurable accessibility checks.
Overview
depictr provides a shared visual language for exploratory graphics, model estimates, diagnostics, uncertainty and power analyses. Its R and Python implementations use the same naming and colour conventions, while returning ordinary plot objects that can still be adapted to a study's needs. The accessibility audit checks the rendered figure rather than assuming that a palette is sufficient.
Illustrative outputs
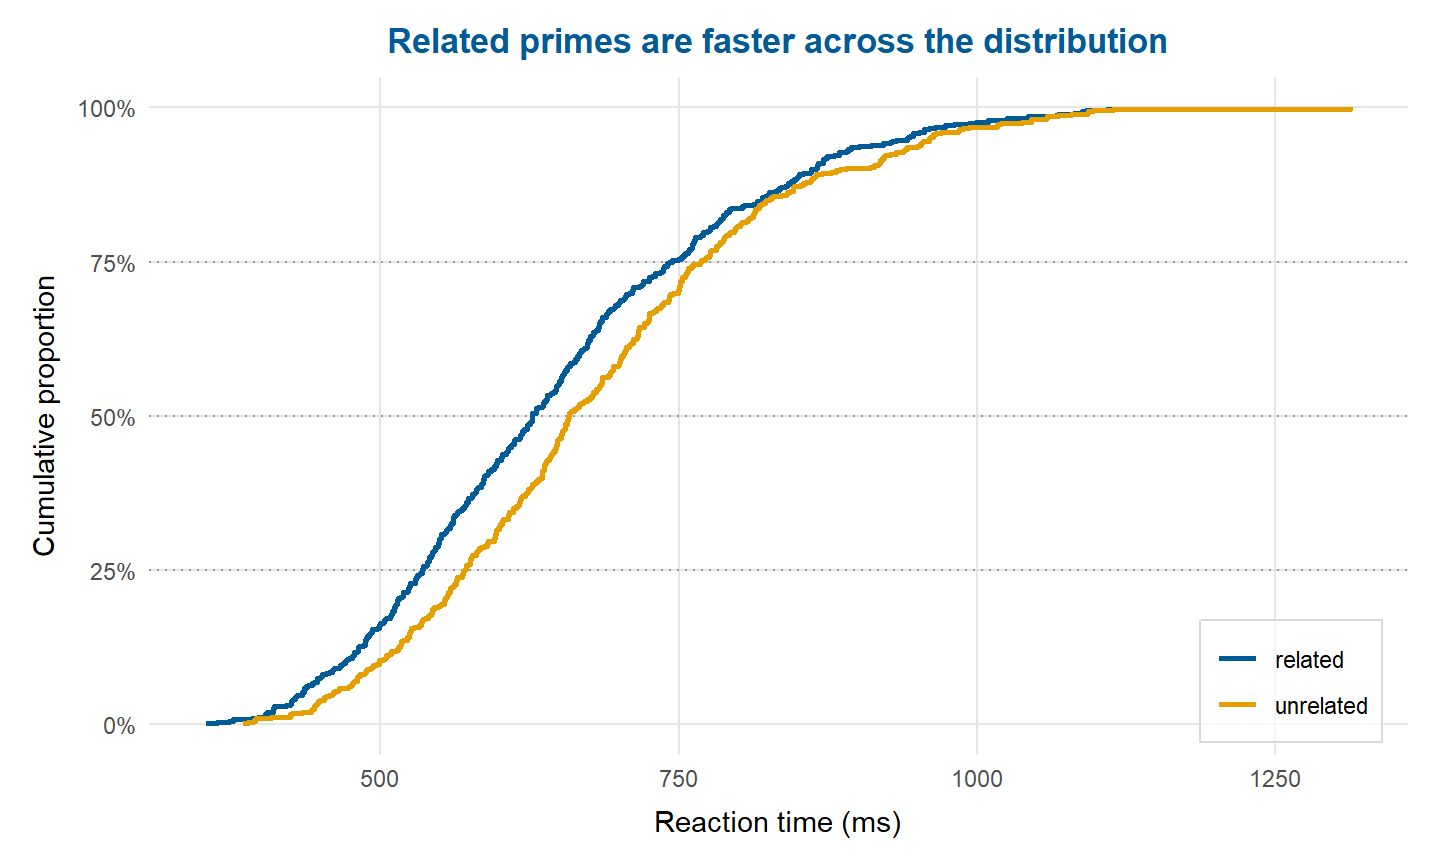
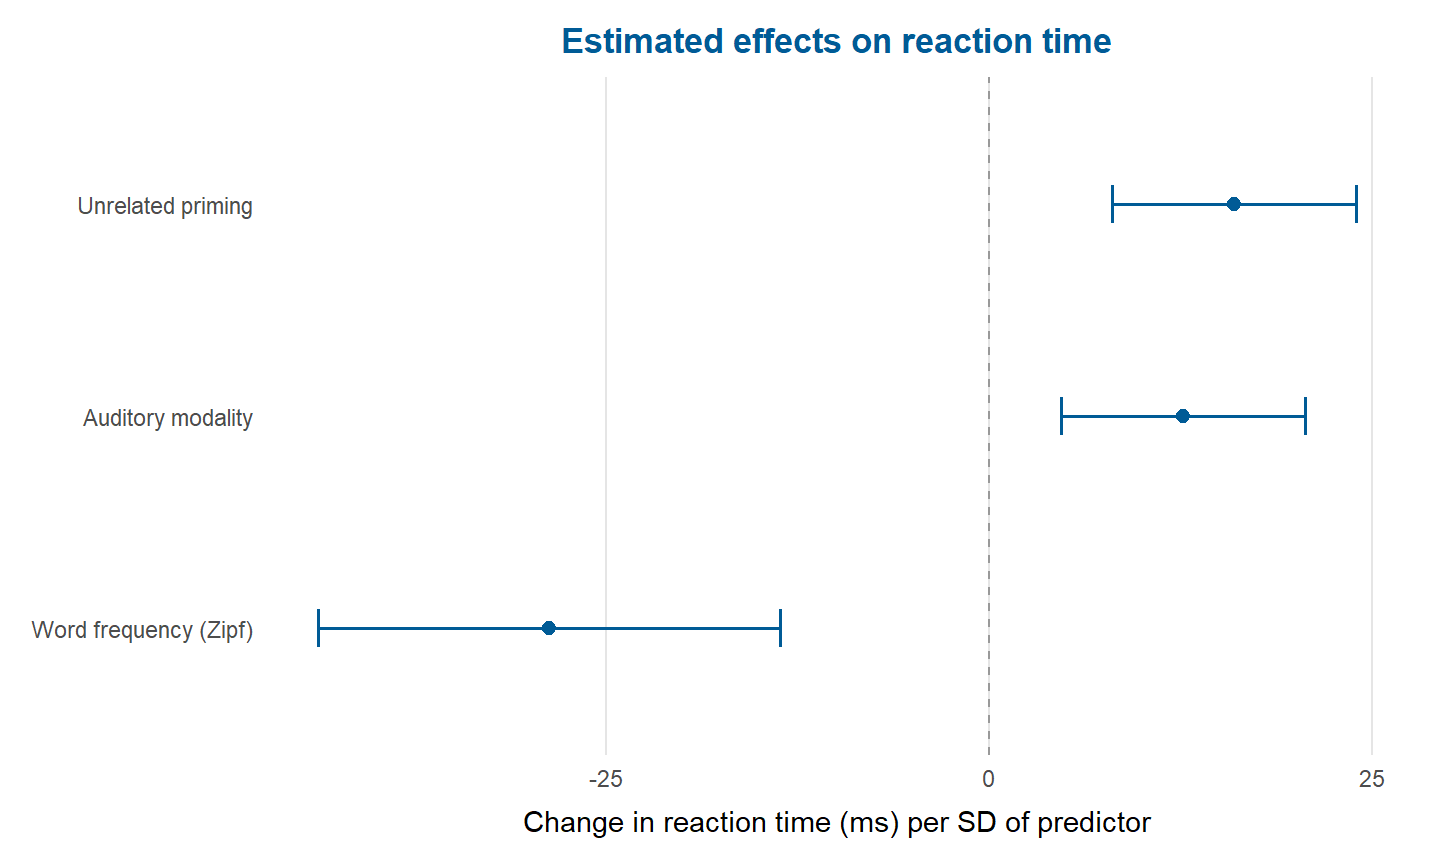
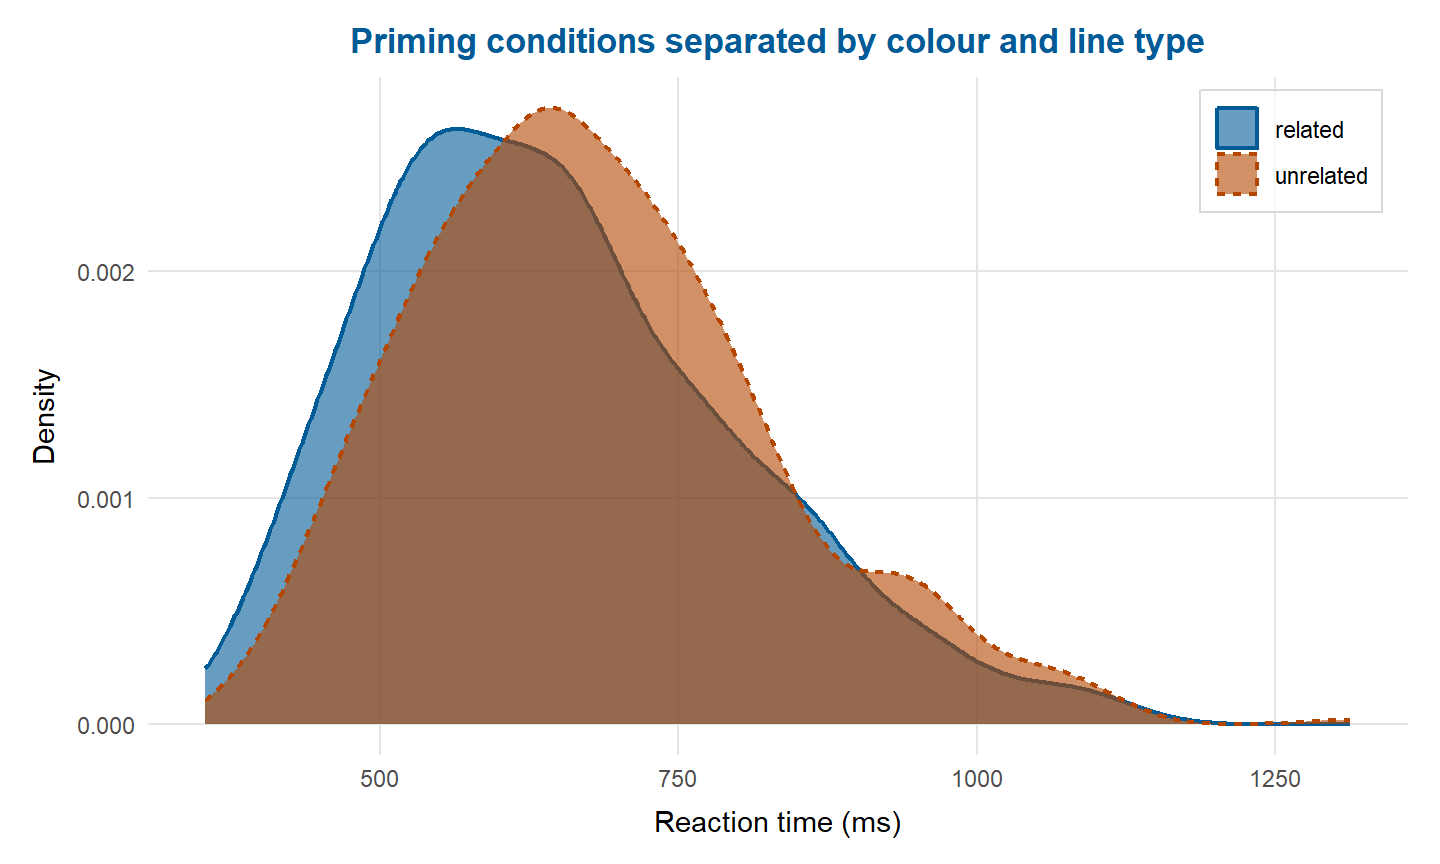
The figures below are larger examples from the companion article. They show how a single analysis can move from an observed distribution to model estimates and then to an audited, publication-ready display.
Reproducibility and accessibility
The recommended workflow is to keep the plotting code with the analysis, record the package version and run the audit on the exact figure that will be submitted or presented. Alt text and a meaningful caption remain part of the author's editorial responsibility. See the R documentation, Python documentation and companion blog post for runnable examples.
Reference
Bernabeu, P. (2026). depictr: A unified toolkit for visualising statistical models and data (Version 0.3.0) [Computer software]. CRAN. https://doi.org/10.32614/CRAN.package.depictr
Comments are provided by Disqus and are not loaded automatically. Loading them connects your browser to Disqus, which may use cookies and process data under its privacy policy. See this site's privacy notice for details.