depictr#
A unified, colourblind-safe toolkit for publication-ready statistical visualisation, built on plotnine. It is the Python sibling of the depictr R package.
What it gives you#
Python already has an excellent plot for almost any statistical task, but they
live in different packages with different defaults, different APIs and different
colour schemes. depictr gives the whole workflow one theme, one colourblind-safe
palette and one calling convention, and returns plotnine objects you can keep
extending with +. Where a specialist package already computes a quantity well,
depictr delegates to it and redraws the result under the shared theme.
The default palette is the Okabe-Ito set, and that choice is checked rather than asserted: the package ships a Machado-2009 colour-vision-deficiency simulator and a CIE-Lab distance test that confirms the colours stay distinguishable under each deficiency.
Installation#
depictr is on PyPI:
pip install depictr            # core (plotnine, pandas, numpy)
pip install depictr[all]       # plus the optional computation back-ends
The classification, model and survival plots delegate to scikit-learn, statsmodels and lifelines; each is an optional dependency, so the core stays light.
A first plot#
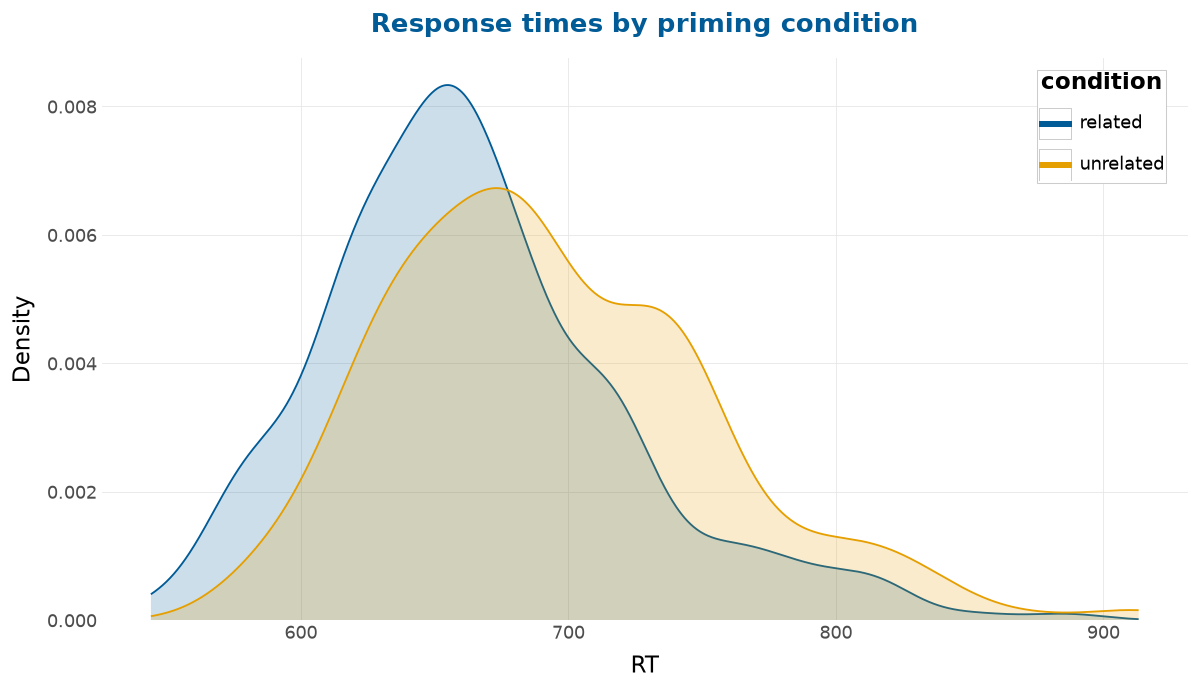
import depictr as dp

ld = dp.lexical_decision()
dp.explore_distribution(ld, "RT", group="condition", kind="both")
The gallery works through every family with the plots rendered, and the API reference documents each function.