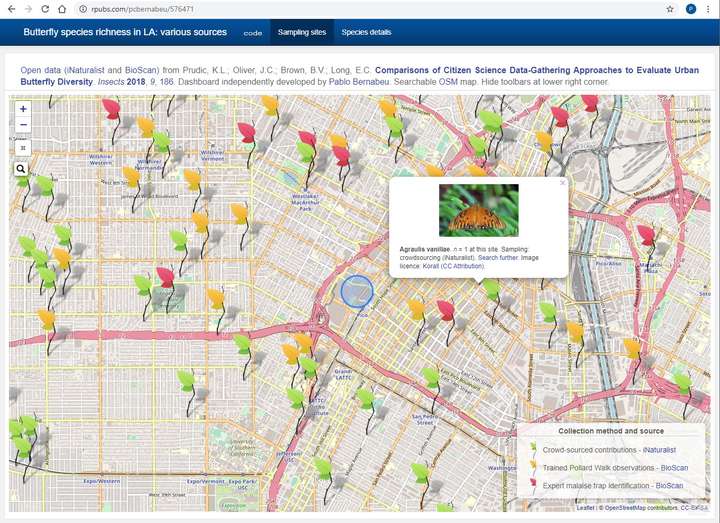
This dashboard presents open data (iNaturalist and BioScan) from Prudic et al. (2018). In their study, Prudic et al. compared citizen science with traditional methods in the measurement of butterfly populations.
I developed this dashboard after reproducing the analyses of the original study in a Reprohack session.
My coding tasks included transforming the data to a long format,
# There are pseudovariables, that is, observations entered as variables.
# Since most R processes need the tidy format, convert below
# (see https://r4ds.had.co.nz/tidy-data.html). The specific numbers
# found through traps and crowdsourcing methods are preserved.

BioScan = BioScan %>% pivot_longer(
    cols = Anthocharis_sara:Vanessa_cardui, names_to = "Species",
    values_to = "Number", values_drop_na = TRUE
  )

# Compare
#str(BioScan)
#str(dat)
# 928 rows now; the result of 29 pseudo-variables being transposed
# into rows, interacting with 32 previous rows, i.e., 29 * 32 = 928.
merging three data sets,
# The iNaturalist data set presents a challenge that differs from the
# pseudovariables found above. The number of animals of each species
# must be computed from repeated entries, per site.

iNaturalist = merge(iNaturalist,
                    iNaturalist %>%
                      count(species, site, name = 'Number'))
and, as ever, wrangling with the format of the dashboard pages to preserve the format of a table.
Species details {style="background-color: #FCFCFC;"}
=======================================================================

Column {style="data-width:100%; position:static; height:1000px;"}
-----------------------------------------------------------------------
Reference
Prudic, K. L., Oliver, J. C., Brown, B. V., & Long, E. C. (2018). Comparisons of citizen science data-gathering approaches to evaluate urban butterfly diversity. Insects, 9(4), 186. https://doi.org/10.3390/insects9040186