Speculation across various scientific topics
Given all of the data that E&L [Evans & Levinson, 2009] cite, how could anyone maintain the notion of a universal grammar with linguistic content? Traditionally, there have been three basic strategies. First, just as we may force English grammar into the Procrustean bed of Latin grammar – that is how I was taught the structure of English in grade school – the grammars of the world’s so-called exotic languages may be forced into an abstract scheme based mainly on European languages.
— Tomasello (2009)
Some research topics invite speculation more than others. When Pieter Vogt and I reviewed the field of language evolution a decade ago, the impression was of a literature carrying a good deal more conjecture than evidence, for the understandable reason that the events under study left no direct trace (Bernabeu & Vogt, 2015). The passage from Tomasello quoted above makes a similar complaint about universal grammar. An impression of this kind can be checked, at least crudely, by counting. Authors who speculate in print often say so, in phrases such as ‘we speculate that’ or ‘it is tempting to speculate’, and those phrases are indexed when they occur in a title, an abstract or a keyword list. The share of records in a literature that contain a form of the word ‘speculate’ is therefore a rough measure of how openly conjectural that literature is, or at least of how often its authors label their conjectures as such.
This post compares that share, year by year from 1980 to the present, across nine reference literatures. Six of them concern language: language evolution, language comprehension, language disorders, linguistic relativity, language teaching and the bilingual advantage. A seventh, sensorimotor simulation, is the topic of my own doctoral work on conceptual processing. The last two, artificial general intelligence and the hadron collider, sit outside the language sciences and serve as points of comparison, one being a field where speculation might be expected and the other a field of large instruments and large collaborations. Each reference literature is defined by a query on the title, abstract and keywords, and the comparison counts, within each year, the records that also match speculat* in the same fields.
The searches
An earlier draft of this post ran the searches through a set of functions that I had written around the rscopus package. Those functions have since become the scopusflow package, and the searches now live in a script in the website’s repository that a GitHub Actions workflow runs on request, with the Scopus key held as a repository secret. The workflow commits the counts to the post’s directory, so the figures below can be rebuilt from the committed data without a key, and the searches can be refreshed by anyone with a key by dispatching the workflow. The nine queries are given below.
library(scopusflow)

years <- 1980:as.integer(format(Sys.Date(), '%Y'))

topics <- c(
  'language evolution'              = '"language evolution" OR "evolution of language"',
  'language comprehension'          = '"language comprehension"',
  'language disorders'              = '"language disorders" OR "language disorder"',
  'linguistic relativity'           = '"linguistic relativity"',
  'language teaching'               = '"language teaching"',
  'bilingual advantage'             = '"bilingual advantage" OR "bilingual advantages"',
  'sensorimotor simulation'         = '"sensorimotor simulation"',
  'artificial general intelligence' = '"artificial general intelligence"',
  'hadron collider'                 = '"hadron collider"'
)

comparisons <- lapply(names(topics), function(label) {
  cmp <- scopus_compare_topics(
    reference_query  = topics[[label]],
    comparison_terms = 'speculat*',
    years            = years,
    field            = 'TITLE-ABS-KEY'
  )
  cmp$topic <- label
  cmp
})
The function counts, for every year, the records matching the reference query and the records matching both the reference query and the comparison term, so the nine comparisons cost 846 count requests. Each row of the result holds a year, the count for the reference literature, the count for the comparison and the comparison as a percentage of the reference.
library(dplyr)
library(ggplot2)

comparisons <- readRDS('searches/speculation_comparisons.rds')
retrieved <- attr(comparisons, 'retrieved')
retrieved
#> [1] "2026-09-02 06:36 UTC"speculation <- bind_rows(comparisons) |>
filter(query_type == 'comparison') |>
transmute(topic, year, reference_n, n,
percentage = comparison_percentage)
head(speculation)#> # A tibble: 6 × 5
#> topic year reference_n n percentage
#> <chr> <int> <dbl> <dbl> <dbl>
#> 1 language evolution 1980 5 0 0
#> 2 language evolution 1981 4 0 0
#> 3 language evolution 1982 4 0 0
#> 4 language evolution 1983 1 0 0
#> 5 language evolution 1984 5 0 0
#> 6 language evolution 1985 6 0 0The searches were run on 2 September 2026, so the final year is incomplete and its share rests on fewer records than the years before it.
Sizes of the literatures
The nine literatures differ in size by orders of magnitude, and the size matters for reading the percentages. A share computed on a few dozen records moves by several points when one or two abstracts mention speculation, whereas a share computed on thousands of records barely moves at all.
totals <- speculation |>
  group_by(topic) |>
  summarise(records = sum(reference_n), with_speculation = sum(n),
            share = 100 * with_speculation / records,
            first_year_with_records = min(year[reference_n > 0])) |>
  arrange(desc(share))
totals
#> # A tibble: 9 × 5
#> topic records with_speculation share first_year_with_records
#> <chr> <dbl> <dbl> <dbl> <int>
#> 1 artificial general intelligence 1913 49 2.56 2006
#> 2 language evolution 3376 48 1.42 1980
#> 3 linguistic relativity 739 9 1.22 1980
#> 4 bilingual advantage 637 4 0.628 1993
#> 5 language comprehension 6543 24 0.367 1980
#> 6 language disorders 14255 36 0.253 1980
#> 7 language teaching 22957 42 0.183 1980
#> 8 hadron collider 18457 20 0.108 1980
#> 9 sensorimotor simulation 132 0 0 2003Across the whole period, the share of records that mention speculation is highest in the literature on artificial general intelligence (2.6%) and lowest in sensorimotor simulation (0.0%), with the language literatures spread between those two.
# Nine literatures against an eight-colour palette, so the Okabe-Ito set is
# extended with one grey. Nine lines on one panel are hard to tell apart by
# colour alone, which is why the figure that follows gives each its own panel.
nine_colours <- c('#E69F00', '#56B4E9', '#009E73', '#F0E442', '#0072B2',
                  '#D55E00', '#CC79A7', '#999999', '#000000')
ggplot(filter(speculation, reference_n > 0),
       aes(year, reference_n, colour = topic)) +
  geom_line(linewidth = 0.8) +
  scale_y_log10(labels = scales::label_comma()) +
  scale_colour_manual(values = nine_colours) +
  labs(x = NULL, y = 'Records per year (log scale)', colour = NULL) +
  theme_minimal(base_size = 12) +
  theme(legend.position = 'right')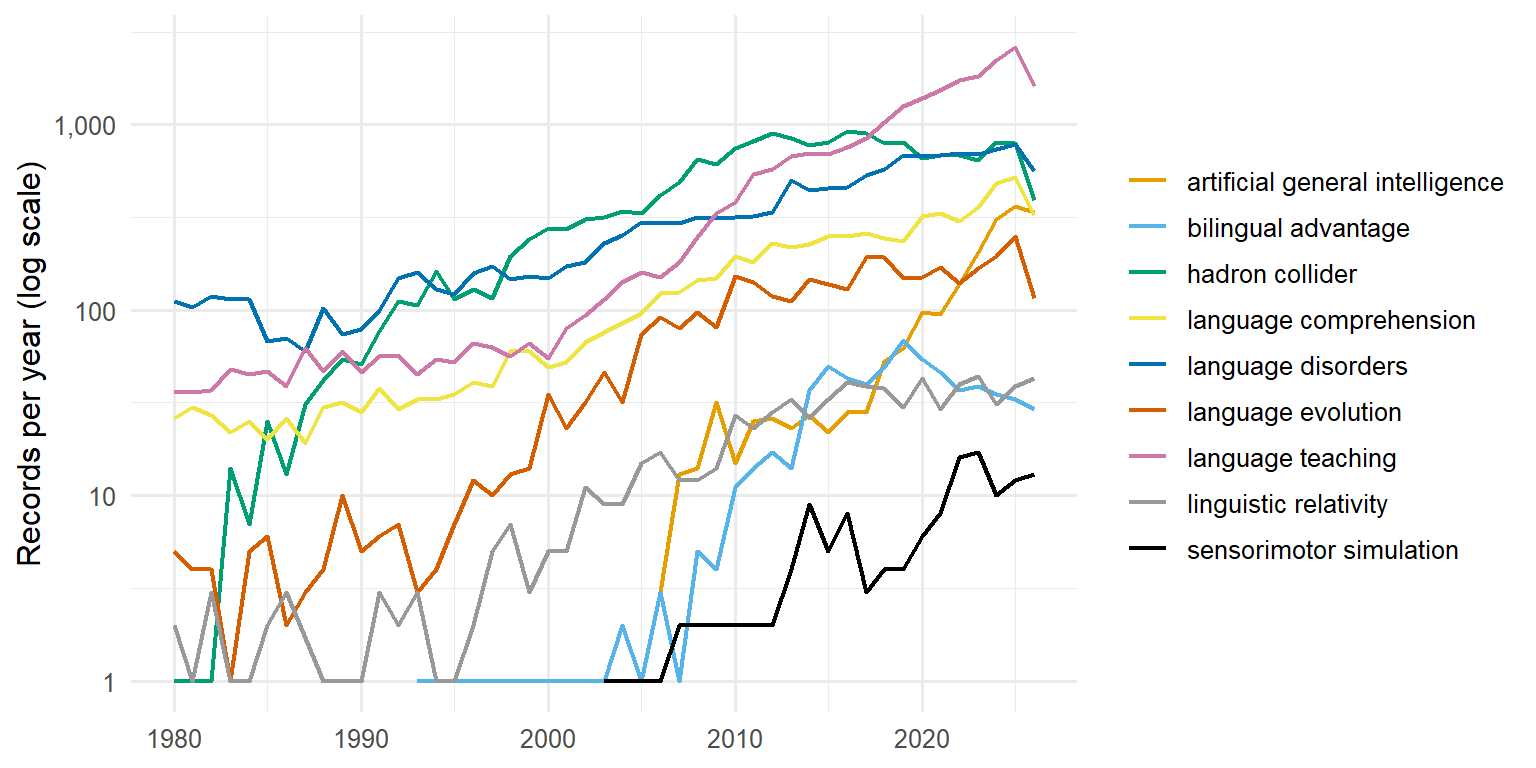
The share of records that mention speculation
Each panel below shows one literature. The line is the yearly percentage of records that also match speculat*, the shaded band is a stability range computed by the Wilson method from the two yearly counts, which conveys how much the share would move with a handful of records, and the panels are ordered from the most to the least speculative literature over the whole period. The axis is cut at 15%, which clips the bands in the early years of the small literatures, where a single abstract would move the share by tens of points. The highest share in the data, the 33% that 1 of the 3 records on bilingual advantage in 2006 represent, sits above that cut and is clipped with them. Years in which a literature has no records break the line.
wilson <- function(k, n, z = 1.96) {
  p <- k / n
  centre <- (p + z^2 / (2 * n)) / (1 + z^2 / n)
  half <- z * sqrt(p * (1 - p) / n + z^2 / (4 * n^2)) / (1 + z^2 / n)
  data.frame(lower = 100 * pmax(0, centre - half), upper = 100 * pmin(1, centre + half))
}

# Years with no records keep their row but carry NA, so that ggplot2 breaks the
# line there instead of drawing a segment across a gap in the literature.
panel_data <- speculation |>
  mutate(topic = factor(topic, levels = totals$topic)) |>
  bind_cols(wilson(speculation$n, speculation$reference_n)) |>
  mutate(across(c(percentage, lower, upper), ~ ifelse(reference_n > 0, .x, NA_real_)))

panel_labels <- totals |>
  mutate(label = sprintf('%s\n%s records, %.1f%% with speculat*',
                         topic, format(records, big.mark = ','), share))
labeller_topic <- setNames(panel_labels$label, panel_labels$topic)

ggplot(panel_data, aes(year, percentage)) +
  geom_ribbon(aes(ymin = lower, ymax = upper), fill = '#0072B2', alpha = 0.15) +
  geom_line(colour = '#0072B2', linewidth = 0.7) +
  geom_point(colour = '#0072B2', size = 0.9) +
  facet_wrap(~ topic, ncol = 3, labeller = as_labeller(labeller_topic)) +
  scale_y_continuous(labels = scales::label_percent(scale = 1)) +
  coord_cartesian(ylim = c(0, 15)) +
  labs(x = NULL, y = 'Records mentioning speculation (%)') +
  theme_minimal(base_size = 12) +
  theme(strip.text = element_text(size = 10, hjust = 0),
        panel.spacing = unit(1.2, 'lines'))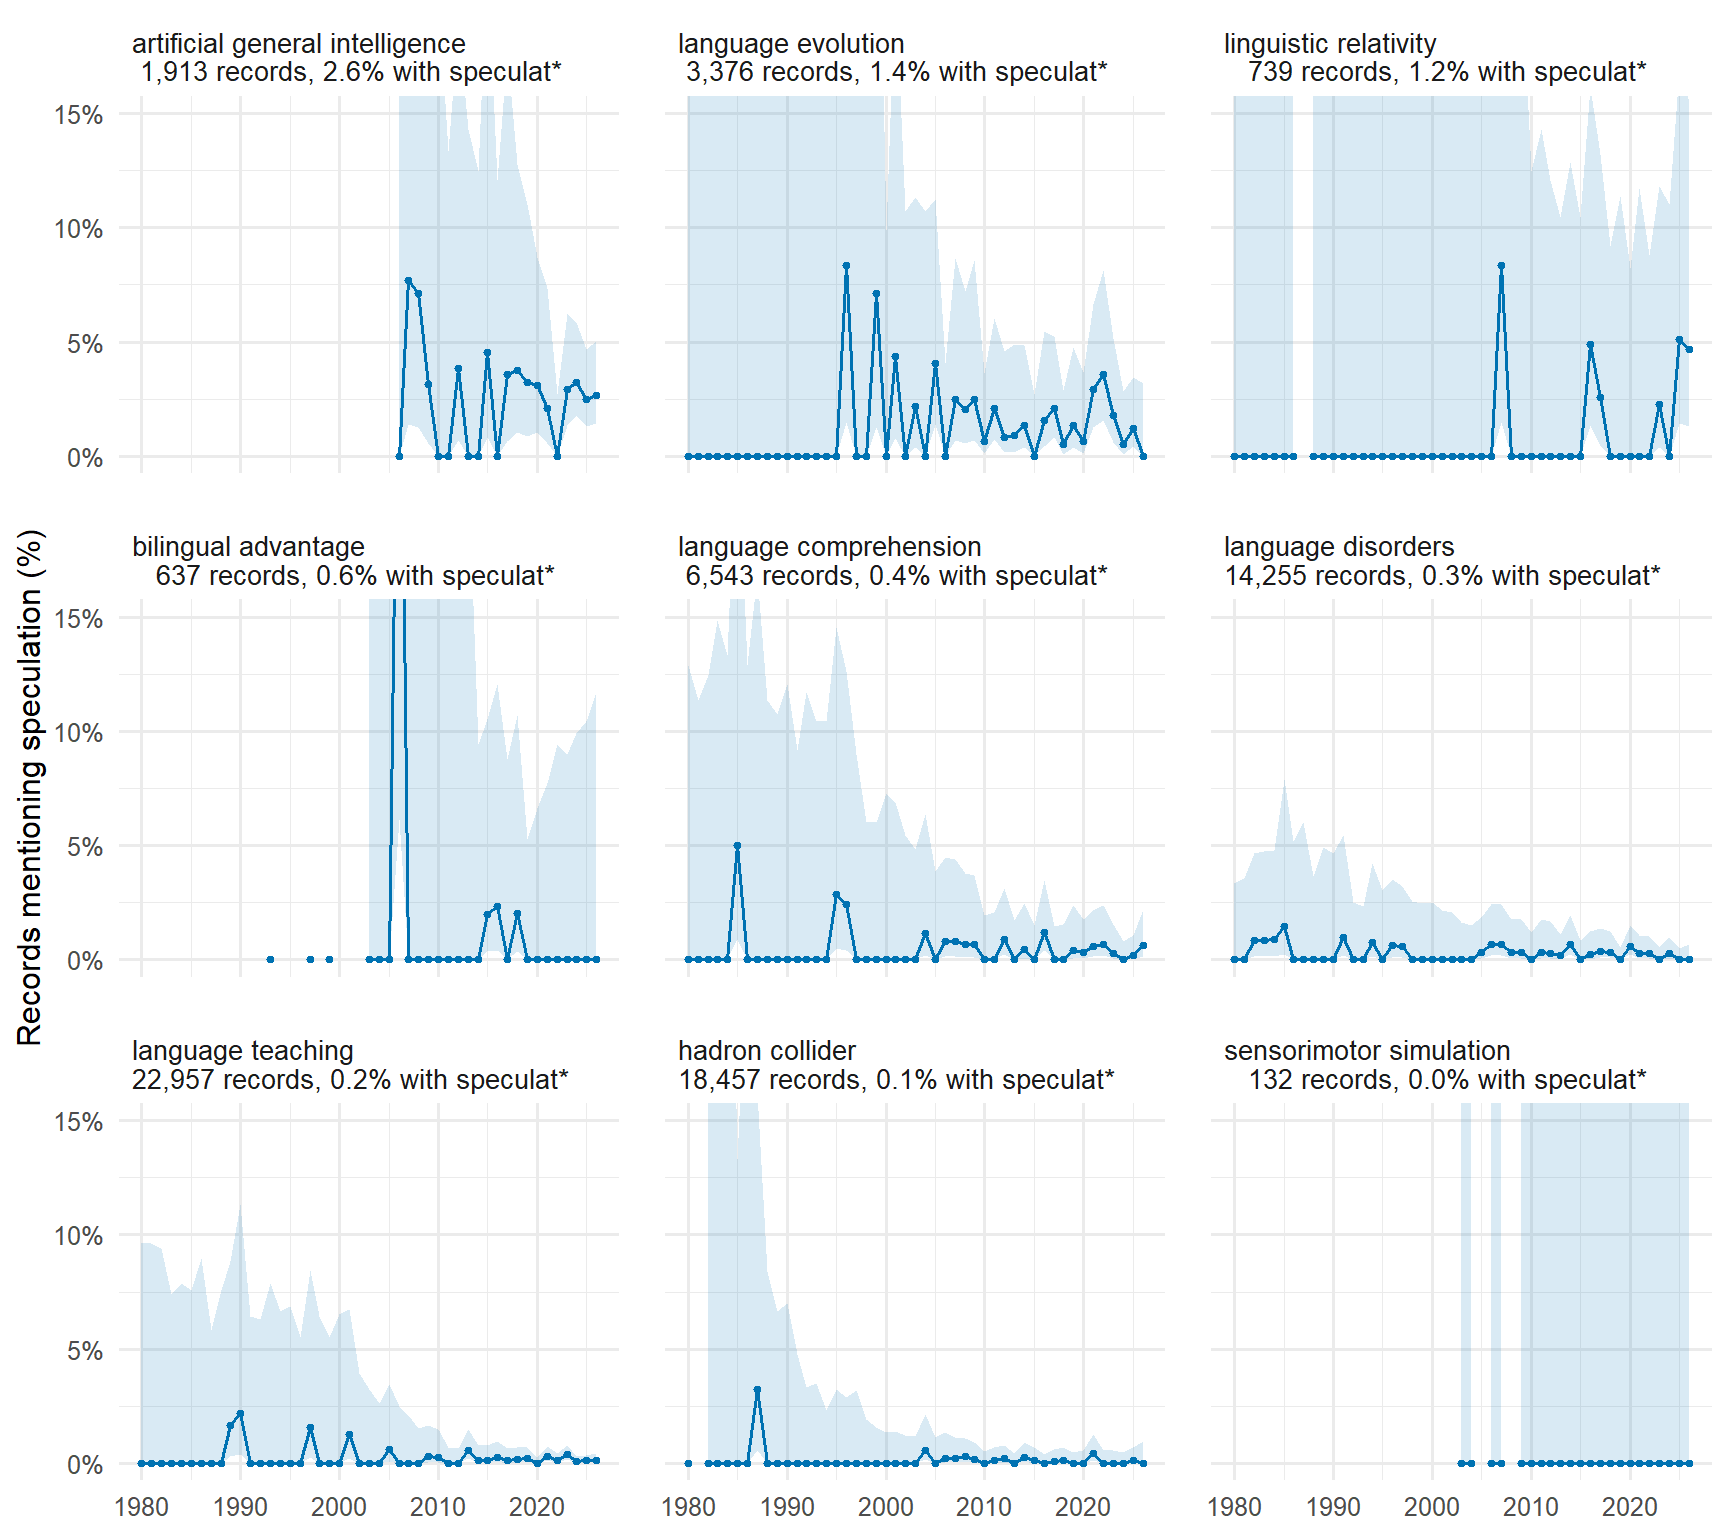
recent <- speculation |>
  filter(year >= 2016, year <= max(year) - 1) |>
  group_by(topic) |>
  summarise(records = sum(reference_n),
            share = 100 * sum(n) / sum(reference_n)) |>
  arrange(desc(share))
recent
#> # A tibble: 9 × 3
#> topic records share
#> <chr> <dbl> <dbl>
#> 1 artificial general intelligence 1377 2.54
#> 2 linguistic relativity 374 1.60
#> 3 language evolution 1734 1.56
#> 4 bilingual advantage 445 0.449
#> 5 language comprehension 3298 0.334
#> 6 language disorders 6511 0.230
#> 7 language teaching 15193 0.178
#> 8 hadron collider 7682 0.0781
#> 9 sensorimotor simulation 88 0Restricting the comparison to the last ten complete years, 88 to 15,193 records per literature, gives the ranking above. The literature on artificial general intelligence leads with 2.5% of its records mentioning speculation, and that on sensorimotor simulation closes the list with 0.0%.
What the counts can and cannot show
The measure is crude in ways that the figures make visible. A form of ‘speculate’ in an abstract is as often a mark of candour as of conjecture, since the authors who write ‘we speculate that’ are labelling a claim that others would present without a label, and a literature with a strong convention of hedged abstracts will score higher for that reason alone. The wildcard also catches ‘speculative’ in senses that have nothing to do with scientific conjecture, such as speculative execution in computing or speculative investment in economics, and both senses can occur in the literatures on artificial general intelligence and on the hadron collider, whose funding is discussed in economic terms. The queries define each literature by a phrase, so records that belong to a field without using its name are missed, and the literatures on language teaching and language disorders are far larger than their phrases suggest. Percentages for the early years, when a literature had a handful of records, are shown with their intervals so that a single abstract is not read as a trend.
The smallest literature, sensorimotor simulation, contains no record that mentions speculation at all, which with 132 records over the whole period says more about the size of the literature than about its habits.
With those limits in mind, the pattern across the language sciences is consistent with the impression that started the exercise. Literatures that theorise about unobservable or contested processes carry more explicit speculation than literatures organised around a clinical population, a classroom or an instrument, and the difference is visible in abstracts before any reading of the articles themselves. Whether the speculation is a symptom of immaturity or a healthy habit of labelling conjecture is a question that counts cannot answer. Anyone who wants to add a topic, or to see how the shares have moved, can dispatch the workflow again from the repository.
References
Bernabeu, P., & Vogt, P. (2015). Language evolution: Current status and future directions [Paper presentation]. Tenth Language at the University of Essex (LangUE) Postgraduate Conference, Colchester, United Kingdom. https://www.researchgate.net/publication/280858062_Language_evolution_Current_status_and_future_directions
Evans, N., & Levinson, S. C. (2009). The myth of language universals: Language diversity and its importance for cognitive science. Behavioral and Brain Sciences, 32(5), 429–492. https://doi.org/10.1017/S0140525X0999094X
Tomasello, M. (2009). Universal grammar is dead. Behavioral and Brain Sciences, 32(5), 470–471. https://doi.org/10.1017/S0140525X09990744
Comments are provided by Disqus and are not loaded automatically. Loading them connects your browser to Disqus, which may use cookies and process data under its privacy policy. See this site's privacy notice for details.